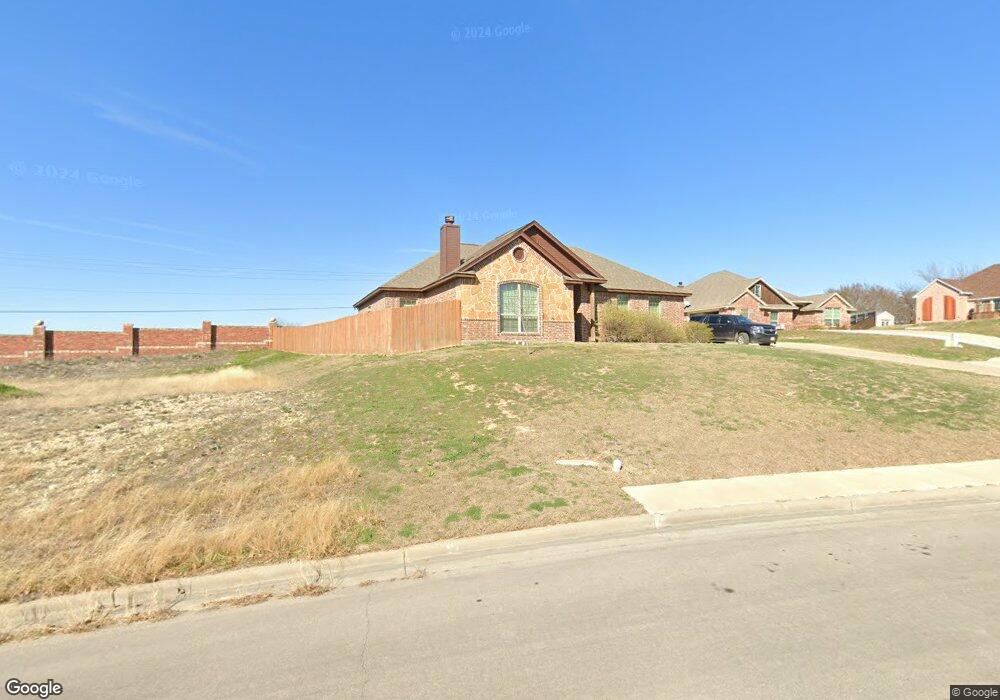
2133 Trace Ridge Dr Weatherford, TX 76087
Estimated Value: $322,243 - $353,000
3
Beds
2
Baths
1,648
Sq Ft
$208/Sq Ft
Est. Value
About This Home
This home is located at 2133 Trace Ridge Dr, Weatherford, TX 76087 and is currently estimated at $342,061, approximately $207 per square foot. 2133 Trace Ridge Dr is a home located in Parker County with nearby schools including Austin Elementary School, Hall Middle School, and Weatherford High School.
Ownership History
Date
Name
Owned For
Owner Type
Purchase Details
Closed on
Dec 10, 2019
Sold by
Rich Stephanie L
Bought by
Woods Garett R and Woods Lindy M
Current Estimated Value
Home Financials for this Owner
Home Financials are based on the most recent Mortgage that was taken out on this home.
Original Mortgage
$193,918
Outstanding Balance
$171,301
Interest Rate
3.7%
Mortgage Type
New Conventional
Estimated Equity
$170,760
Purchase Details
Closed on
Aug 14, 2015
Sold by
Aaron Tony
Bought by
Apex Homes Inc
Home Financials for this Owner
Home Financials are based on the most recent Mortgage that was taken out on this home.
Original Mortgage
$162,545
Interest Rate
4.12%
Mortgage Type
FHA
Purchase Details
Closed on
Aug 13, 2015
Sold by
Apex Homes
Bought by
Rich Stephanie L
Home Financials for this Owner
Home Financials are based on the most recent Mortgage that was taken out on this home.
Original Mortgage
$162,545
Interest Rate
4.12%
Mortgage Type
FHA
Purchase Details
Closed on
Jan 10, 2014
Sold by
S P Residential Properties L P
Bought by
Rich Stephanie L
Create a Home Valuation Report for This Property
The Home Valuation Report is an in-depth analysis detailing your home's value as well as a comparison with similar homes in the area
Home Values in the Area
Average Home Value in this Area
Purchase History
| Date | Buyer | Sale Price | Title Company |
|---|---|---|---|
| Woods Garett R | -- | None Available | |
| Apex Homes Inc | -- | Fnt | |
| Rich Stephanie L | -- | Fnt | |
| Rich Stephanie L | -- | -- |
Source: Public Records
Mortgage History
| Date | Status | Borrower | Loan Amount |
|---|---|---|---|
| Open | Woods Garett R | $193,918 | |
| Previous Owner | Rich Stephanie L | $162,545 |
Source: Public Records
Tax History Compared to Growth
Tax History
| Year | Tax Paid | Tax Assessment Tax Assessment Total Assessment is a certain percentage of the fair market value that is determined by local assessors to be the total taxable value of land and additions on the property. | Land | Improvement |
|---|---|---|---|---|
| 2025 | $6,273 | $328,807 | $50,000 | $278,807 |
| 2024 | $6,273 | $325,440 | $40,000 | $285,440 |
| 2023 | $6,273 | $325,440 | $40,000 | $285,440 |
| 2022 | $5,391 | $243,060 | $28,000 | $215,060 |
| 2021 | $5,398 | $243,060 | $28,000 | $215,060 |
| 2020 | $4,937 | $204,330 | $28,000 | $176,330 |
| 2019 | $5,441 | $213,050 | $28,000 | $185,050 |
| 2018 | $4,644 | $181,040 | $28,000 | $153,040 |
| 2017 | $4,764 | $181,040 | $28,000 | $153,040 |
| 2016 | $4,265 | $162,080 | $28,000 | $134,080 |
| 2015 | $721 | $28,000 | $28,000 | $0 |
| 2014 | $703 | $28,000 | $28,000 | $0 |
Source: Public Records
Map
Nearby Homes
- 2117 Trace Ridge Dr
- 2137 Trace Ridge Dr
- 2109 Valley Dr
- 2310 Trace Ridge Dr
- 1421 Highlake Ln
- 1209 Timber Creek Dr
- 365 Bonita St
- 376 Bonita St
- 2577 Lockwood Ln
- 365 Paloma St
- 725 Red Oak Ln
- 510 Lockwood Ln
- 1628 Holland Lake Dr
- 952 Austin Ct
- 368 Lockwood Ln
- 946 Austin Ct
- 938 Austin Ct
- 915 Austin Ct
- 101 Black Forest Dr
- 118 Black Forest Dr
- 2129 Trace Ridge Dr
- 2125 Trace Ridge Dr
- 2126 Trace Ridge Dr
- 2141 Trace Ridge Dr
- 2201 Trace Ridge Dr
- 2202 Trace Ridge Dr
- 2122 Trace Ridge Dr
- 2121 Trace Ridge Dr
- 2205 Trace Ridge Dr
- 2101 Ridgecrest Dr
- 2206 Trace Ridge Dr
- 2118 Trace Ridge Dr
- 2102 Ridgecrest Dr
- 2105 Ridgecrest Dr
- 2210 Trace Ridge Dr
- 2114 Trace Ridge Dr
- 2213 Trace Ridge Dr
- 4 Fossil Hill Rd
- 2109 Ridgecrest Dr
- 2214 Trace Ridge Dr