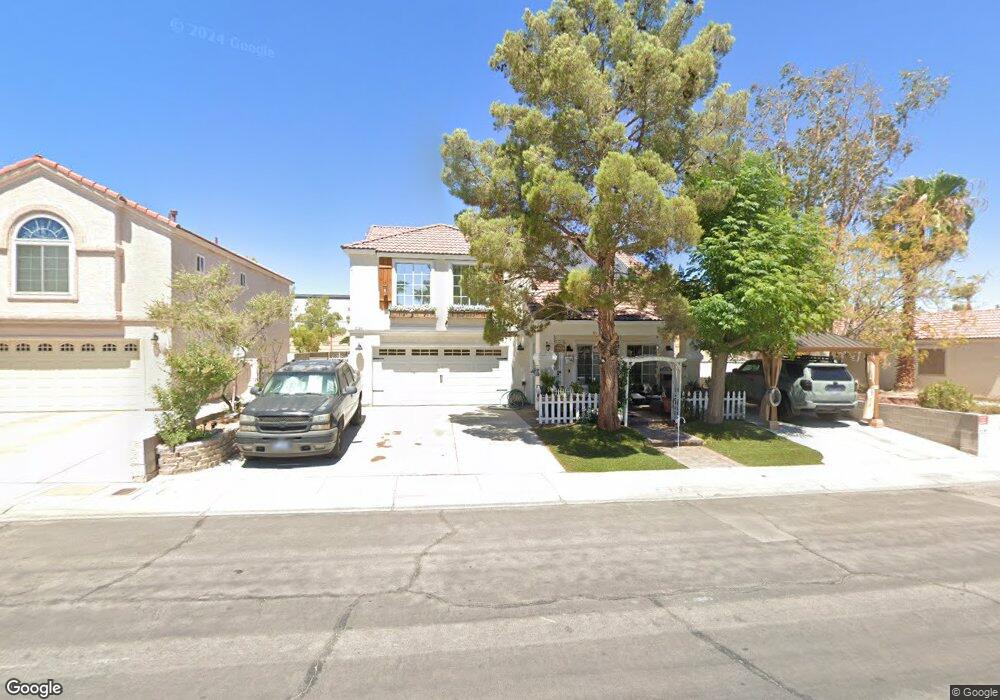
2134 Daisy Meadow Ln North Las Vegas, NV 89032
Cheyenne NeighborhoodEstimated Value: $472,000 - $508,000
4
Beds
3
Baths
2,399
Sq Ft
$202/Sq Ft
Est. Value
About This Home
This home is located at 2134 Daisy Meadow Ln, North Las Vegas, NV 89032 and is currently estimated at $485,794, approximately $202 per square foot. 2134 Daisy Meadow Ln is a home located in Clark County with nearby schools including Richard C. Priest Elementary School, Theron L Swainston Middle School, and Cheyenne High School.
Ownership History
Date
Name
Owned For
Owner Type
Purchase Details
Closed on
Sep 10, 2021
Sold by
Zuniga Juan Martin
Bought by
Zuniga Juan Martin and Zuniga Maricela
Current Estimated Value
Purchase Details
Closed on
Jun 30, 2020
Sold by
Zuniga Juan Martin
Bought by
Zuniga Juan Martin and Zuniga Maricela
Purchase Details
Closed on
Apr 28, 2005
Sold by
Zuniga Marisela
Bought by
Zuniga Juan Martin
Home Financials for this Owner
Home Financials are based on the most recent Mortgage that was taken out on this home.
Original Mortgage
$241,600
Interest Rate
5.99%
Mortgage Type
Fannie Mae Freddie Mac
Purchase Details
Closed on
Jul 5, 2003
Sold by
Mojo Trust
Bought by
Sayers Bob and Gm Financial City Of Calgary & Las Vegas
Purchase Details
Closed on
Jun 27, 2003
Sold by
Mojo Trust
Bought by
Hoagland Ron and Hoagland Gabriela E
Purchase Details
Closed on
Dec 12, 2000
Sold by
Gm Financial & Investments Inc
Bought by
The Mojo Trust
Home Financials for this Owner
Home Financials are based on the most recent Mortgage that was taken out on this home.
Original Mortgage
$170,000
Interest Rate
7.86%
Mortgage Type
Seller Take Back
Purchase Details
Closed on
Nov 27, 2000
Sold by
G M Financial & Investments Inc
Bought by
Hoagland Ronald L and Hoagland Gabriela E
Home Financials for this Owner
Home Financials are based on the most recent Mortgage that was taken out on this home.
Original Mortgage
$170,000
Interest Rate
7.86%
Mortgage Type
Seller Take Back
Purchase Details
Closed on
Oct 28, 1999
Sold by
Johnson Michael C and Johnson Bethann
Bought by
G M Financial & Investments Inc
Home Financials for this Owner
Home Financials are based on the most recent Mortgage that was taken out on this home.
Original Mortgage
$140,150
Interest Rate
7.82%
Mortgage Type
Seller Take Back
Purchase Details
Closed on
Jul 29, 1994
Sold by
Pierce Enterprises
Bought by
Monte Vista Residential Corp
Home Financials for this Owner
Home Financials are based on the most recent Mortgage that was taken out on this home.
Original Mortgage
$130,150
Interest Rate
8.38%
Purchase Details
Closed on
Jul 5, 1994
Sold by
Monte Vista Residential Corp
Bought by
Johnson Michael C and Johnson Bethann
Home Financials for this Owner
Home Financials are based on the most recent Mortgage that was taken out on this home.
Original Mortgage
$130,150
Interest Rate
8.38%
Create a Home Valuation Report for This Property
The Home Valuation Report is an in-depth analysis detailing your home's value as well as a comparison with similar homes in the area
Home Values in the Area
Average Home Value in this Area
Purchase History
| Date | Buyer | Sale Price | Title Company |
|---|---|---|---|
| Zuniga Juan Martin | -- | None Listed On Document | |
| Zuniga Juan Martin | -- | None Available | |
| Zuniga Juan Martin | -- | Old Republic Title Co Of Nv | |
| Zuniga Juan Martin | $302,000 | Old Republic Title Co Of Nv | |
| Sayers Bob | $179,650 | Fidelity National Title | |
| Hoagland Ron | -- | Fidelity National Title | |
| The Mojo Trust | -- | -- | |
| Hoagland Ronald L | $185,000 | -- | |
| G M Financial & Investments Inc | $141,000 | Fidelity National Title | |
| Monte Vista Residential Corp | $137,000 | First American Title Company | |
| Johnson Michael C | $137,000 | First American Title Company |
Source: Public Records
Mortgage History
| Date | Status | Borrower | Loan Amount |
|---|---|---|---|
| Previous Owner | Zuniga Juan Martin | $241,600 | |
| Previous Owner | Hoagland Ronald L | $170,000 | |
| Previous Owner | G M Financial & Investments Inc | $140,150 | |
| Previous Owner | Johnson Michael C | $130,150 |
Source: Public Records
Tax History Compared to Growth
Tax History
| Year | Tax Paid | Tax Assessment Tax Assessment Total Assessment is a certain percentage of the fair market value that is determined by local assessors to be the total taxable value of land and additions on the property. | Land | Improvement |
|---|---|---|---|---|
| 2025 | $1,883 | $112,863 | $30,100 | $82,763 |
| 2024 | $1,828 | $112,863 | $30,100 | $82,763 |
| 2023 | $1,828 | $110,229 | $31,500 | $78,729 |
| 2022 | $1,775 | $97,725 | $25,200 | $72,525 |
| 2021 | $1,723 | $90,631 | $21,700 | $68,931 |
| 2020 | $1,670 | $89,169 | $20,650 | $68,519 |
| 2019 | $1,622 | $85,504 | $17,500 | $68,004 |
| 2018 | $1,593 | $80,020 | $14,700 | $65,320 |
| 2017 | $2,685 | $80,038 | $12,950 | $67,088 |
| 2016 | $1,492 | $69,411 | $11,550 | $57,861 |
| 2015 | $1,488 | $59,814 | $7,000 | $52,814 |
| 2014 | $1,445 | $45,333 | $7,000 | $38,333 |
Source: Public Records
Map
Nearby Homes
- 2324 Catskill Ct
- 2714 Saunder Ave
- 4305 Archibald Ct
- 4309 Archibald Ct
- Bellevue NextGen Plan at Craig Point
- Powell Plan at Craig Point
- Skyland Plan at Craig Point
- 2585 Amazing Meadows Ave Unit 1007
- 2495 Sunflower Days Ave Unit 2052
- 4540 Anspach St
- 4465 Shimmering Skies St Unit 1178
- 4253 Gold Desert St
- 1937 Shanon Michelle Ave
- 4466 Verdon St Unit 1171
- 2109 Mountain Sunset Ave
- 1934 Shanon Michelle Ave
- 4533 Queens Hill St
- Bellevue NextGen Plan at Simmance
- Skyland Plan at Simmance
- 1713 Desert Path Ave
- 2124 Daisy Meadow Ln
- 2124 Daisy Meadow Ln Unit n/a
- 2144 Daisy Meadow Ln
- 2154 Daisy Meadow Ln
- 2114 Daisy Meadow Ln
- 4261 Falcon Hill St
- 4266 Country Glen Cir
- 2204 Daisy Meadow Ln
- 2104 Daisy Meadow Ln
- 4253 Falcon Hill St
- 4258 Country Glen Cir Unit 2A
- 4260 Falcon Hill St
- 2214 Daisy Meadow Ln
- 2044 Daisy Meadow Ln
- 4245 Falcon Hill St
- 4252 Falcon Hill St Unit 2A
- 4269 Country Glen Cir
- 4250 Country Glen Cir
- 2224 Daisy Meadow Ln
- 4261 Country Glen Cir