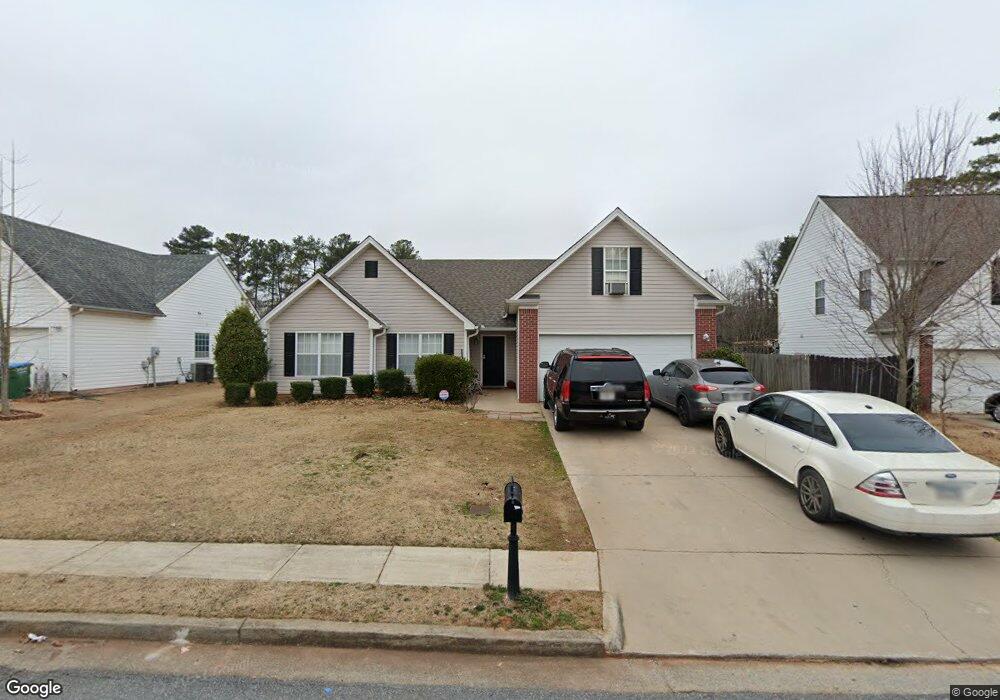
2134 Gwinn Dr Unit 1 Norcross, GA 30071
Estimated Value: $347,570 - $399,000
3
Beds
2
Baths
1,677
Sq Ft
$224/Sq Ft
Est. Value
About This Home
This home is located at 2134 Gwinn Dr Unit 1, Norcross, GA 30071 and is currently estimated at $375,393, approximately $223 per square foot. 2134 Gwinn Dr Unit 1 is a home located in Gwinnett County with nearby schools including Baldwin Elementary, Summerour Middle School, and Paul Duke STEM High School.
Ownership History
Date
Name
Owned For
Owner Type
Purchase Details
Closed on
Sep 28, 2000
Sold by
Dupler Charles and Dupler Hoa T
Bought by
Aleksandrova Margarita M
Current Estimated Value
Home Financials for this Owner
Home Financials are based on the most recent Mortgage that was taken out on this home.
Original Mortgage
$75,000
Outstanding Balance
$26,714
Interest Rate
7.97%
Mortgage Type
New Conventional
Estimated Equity
$348,679
Purchase Details
Closed on
Jan 30, 1998
Sold by
Chestnut Creek Builders
Bought by
Dupler Charles and Dupler Hoa T
Home Financials for this Owner
Home Financials are based on the most recent Mortgage that was taken out on this home.
Original Mortgage
$89,900
Interest Rate
6.89%
Mortgage Type
New Conventional
Purchase Details
Closed on
Oct 24, 1997
Sold by
Chestnut Creek Llc
Bought by
Chestnut Creek Builders Llc
Home Financials for this Owner
Home Financials are based on the most recent Mortgage that was taken out on this home.
Original Mortgage
$89,175
Interest Rate
7.39%
Mortgage Type
New Conventional
Create a Home Valuation Report for This Property
The Home Valuation Report is an in-depth analysis detailing your home's value as well as a comparison with similar homes in the area
Home Values in the Area
Average Home Value in this Area
Purchase History
| Date | Buyer | Sale Price | Title Company |
|---|---|---|---|
| Aleksandrova Margarita M | $145,000 | -- | |
| Dupler Charles | $115,900 | -- | |
| Chestnut Creek Builders Llc | $26,500 | -- |
Source: Public Records
Mortgage History
| Date | Status | Borrower | Loan Amount |
|---|---|---|---|
| Open | Aleksandrova Margarita M | $75,000 | |
| Previous Owner | Dupler Charles | $89,900 | |
| Previous Owner | Chestnut Creek Builders Llc | $89,175 |
Source: Public Records
Tax History Compared to Growth
Tax History
| Year | Tax Paid | Tax Assessment Tax Assessment Total Assessment is a certain percentage of the fair market value that is determined by local assessors to be the total taxable value of land and additions on the property. | Land | Improvement |
|---|---|---|---|---|
| 2025 | $5,946 | $158,240 | $31,920 | $126,320 |
| 2024 | $4,953 | $128,280 | $23,200 | $105,080 |
| 2023 | $4,953 | $111,400 | $23,200 | $88,200 |
| 2022 | $4,317 | $111,400 | $23,200 | $88,200 |
| 2021 | $2,980 | $72,760 | $14,000 | $58,760 |
| 2020 | $2,995 | $72,760 | $14,000 | $58,760 |
| 2019 | $2,888 | $72,760 | $14,000 | $58,760 |
| 2018 | $2,887 | $72,760 | $14,000 | $58,760 |
| 2016 | $2,262 | $54,760 | $11,200 | $43,560 |
| 2015 | $2,055 | $48,280 | $8,400 | $39,880 |
| 2014 | $2,065 | $48,280 | $8,400 | $39,880 |
Source: Public Records
Map
Nearby Homes
- 2054 Gwinn Dr
- 5809 Park Rd
- 4314 Cherry Laurel Pass
- 6023 Skellig St
- 6283 Susan Ln
- 2798 Maddison Towns Ave
- 6830 Cedar Glen Rd
- 2802 Cadence Walk Rd
- 2805 Harmony Trail Rd
- 285 Lake Dr
- 283 Lake Dr
- 190 Lake Dr
- 188 Lake Dr
- 186 Lake Dr
- 724 Camelot Way
- 3931 Virginia Ave
- 1763 Brookside Lay Cir
- 805 Olde Mill Ln
- 453 Hunter St
- 2431 Norwood Park Crossing
- 2144 Gwinn Dr
- 2124 Gwinn Dr
- 2133 Gwinn Dr Unit 1
- 2154 Gwinn Dr Unit 1
- 2114 Gwinn Dr Unit 2
- 2143 Gwinn Dr
- 2123 Gwinn Dr
- 2104 Gwinn Dr Unit 2
- 6514 Sage St
- 2164 Gwinn Dr
- 6306 Chestnut Glen Dr Unit 2
- 2153 Gwinn Dr
- 6524 Sage St
- 2174 Gwinn Dr Unit 1
- 6515 Chestnut Bend Dr
- 6316 Chestnut Glen Dr Unit 2
- 2163 Gwinn Dr Unit 1
- 6537 Sage St
- 4801 Ash St