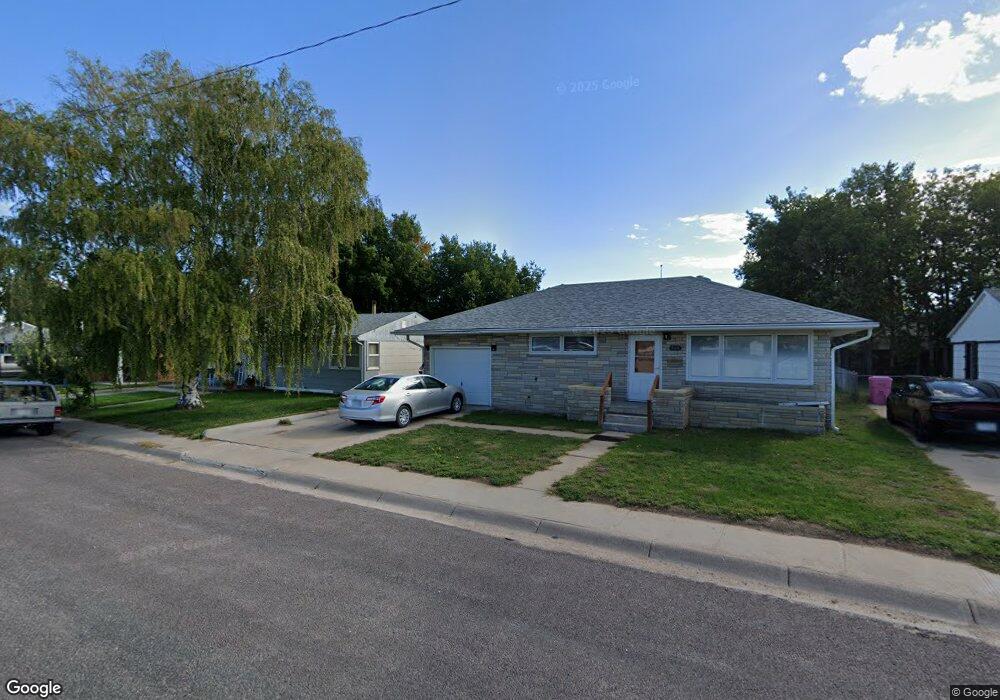
2135 12th Ave Sidney, NE 69162
Estimated Value: $130,000 - $161,000
3
Beds
1
Bath
992
Sq Ft
$142/Sq Ft
Est. Value
About This Home
This home is located at 2135 12th Ave, Sidney, NE 69162 and is currently estimated at $140,549, approximately $141 per square foot. 2135 12th Ave is a home located in Cheyenne County with nearby schools including Central Elementary School, South Ward Elementary School, and North Ward Elementary School.
Ownership History
Date
Name
Owned For
Owner Type
Purchase Details
Closed on
Feb 8, 2023
Bought by
Taylor Randall L and Taylor Deanna M
Current Estimated Value
Purchase Details
Closed on
Jan 24, 2019
Sold by
Jacobsen Evelyn J
Bought by
Vallier Leland M and Vallier Sonja
Purchase Details
Closed on
Aug 22, 2014
Sold by
Keith H Keith H
Bought by
Kokes Taylor J
Home Financials for this Owner
Home Financials are based on the most recent Mortgage that was taken out on this home.
Original Mortgage
$81,632
Interest Rate
4.12%
Mortgage Type
Purchase Money Mortgage
Purchase Details
Closed on
Dec 30, 2009
Sold by
Jacobsen Kathy R
Bought by
Hoagland Keith H
Home Financials for this Owner
Home Financials are based on the most recent Mortgage that was taken out on this home.
Original Mortgage
$75,509
Interest Rate
4.93%
Create a Home Valuation Report for This Property
The Home Valuation Report is an in-depth analysis detailing your home's value as well as a comparison with similar homes in the area
Home Values in the Area
Average Home Value in this Area
Purchase History
| Date | Buyer | Sale Price | Title Company |
|---|---|---|---|
| Taylor Randall L | $103,000 | -- | |
| Vallier Leland M | $65,000 | -- | |
| Kokes Taylor J | -- | -- | |
| Hoagland Keith H | -- | -- |
Source: Public Records
Mortgage History
| Date | Status | Borrower | Loan Amount |
|---|---|---|---|
| Previous Owner | Kokes Taylor J | $81,632 | |
| Previous Owner | Hoagland Keith H | $75,509 |
Source: Public Records
Tax History
| Year | Tax Paid | Tax Assessment Tax Assessment Total Assessment is a certain percentage of the fair market value that is determined by local assessors to be the total taxable value of land and additions on the property. | Land | Improvement |
|---|---|---|---|---|
| 2025 | $1,787 | $100,285 | $9,490 | $90,795 |
| 2024 | $1,737 | $92,007 | $8,707 | $83,300 |
| 2023 | $1,782 | $78,820 | $8,707 | $70,113 |
| 2022 | $1,666 | $71,872 | $8,707 | $63,165 |
| 2021 | $1,653 | $70,722 | $8,707 | $62,015 |
| 2020 | $1,492 | $63,918 | $7,568 | $56,350 |
| 2019 | $1,361 | $58,746 | $7,568 | $51,178 |
| 2018 | $1,549 | $68,307 | $8,798 | $59,509 |
| 2017 | $1,776 | $79,427 | $10,230 | $69,197 |
| 2016 | $1,699 | $79,427 | $10,230 | $69,197 |
| 2015 | $1,719 | $79,427 | $10,230 | $69,197 |
| 2014 | $1,737 | $77,490 | $10,230 | $67,260 |
Source: Public Records
Map
Nearby Homes
- 2446 El Rancho Rd
- 1905 Sidney Draw Rd
- 1229 Linden St
- 1539 Jackson St
- 935 Illinois St
- 801 Deervalley Dr
- 801 Deer Valley Dr
- 4674 Highway 385
- 34414 County Road 53
- 0 Road 50
- 33216 County Road 75
- 4819 Road 125
- 1430 Road 145
- 32307 County Road 75
- Tbd Road 32
- Tbd Road 143
- 4667 Cr 129
- 32207 County Road 75 Unit 32307
- Tbd Road 147
- 9178 Road 48
Your Personal Tour Guide
Ask me questions while you tour the home.