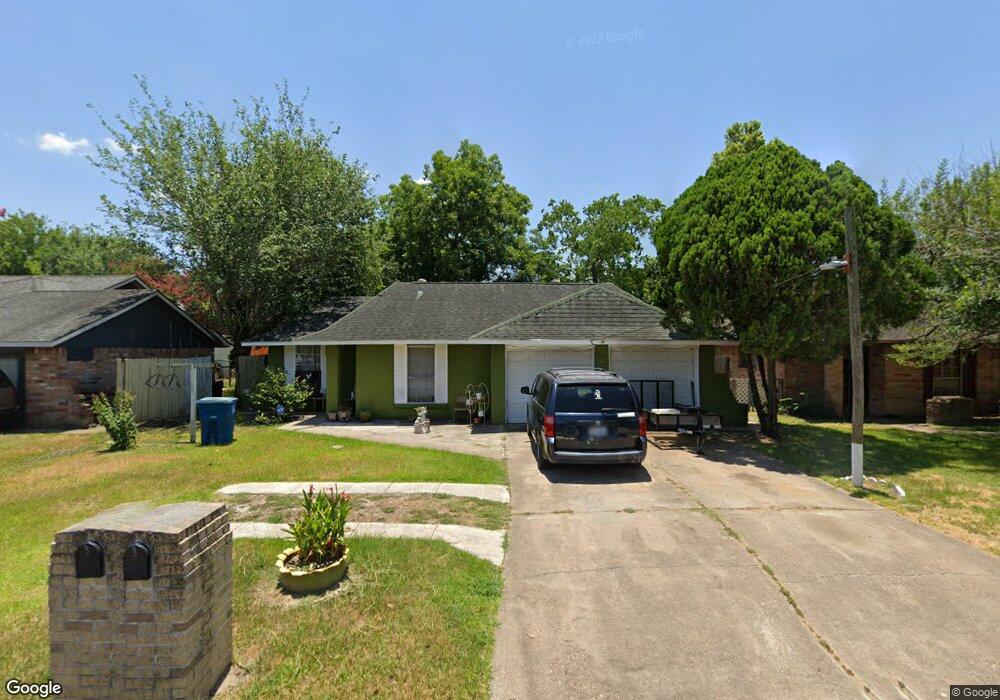
2135 Beaver Bend Rd Houston, TX 77088
Acres Homes NeighborhoodEstimated Value: $184,000 - $211,000
3
Beds
2
Baths
1,132
Sq Ft
$173/Sq Ft
Est. Value
About This Home
This home is located at 2135 Beaver Bend Rd, Houston, TX 77088 and is currently estimated at $196,172, approximately $173 per square foot. 2135 Beaver Bend Rd is a home located in Harris County with nearby schools including Hill Intermediate School, Stovall School, and Dr. Viola K. Garcia Middle School.
Ownership History
Date
Name
Owned For
Owner Type
Purchase Details
Closed on
Jun 1, 2024
Sold by
Alvarado Mauricio O
Bought by
Alvarado Iris
Current Estimated Value
Purchase Details
Closed on
Jul 19, 2001
Sold by
Salazar Roger
Bought by
Alvarado Mauricio O
Home Financials for this Owner
Home Financials are based on the most recent Mortgage that was taken out on this home.
Original Mortgage
$73,045
Interest Rate
7.18%
Mortgage Type
Stand Alone First
Purchase Details
Closed on
May 29, 2001
Sold by
Hud
Bought by
Salazar Roger
Home Financials for this Owner
Home Financials are based on the most recent Mortgage that was taken out on this home.
Original Mortgage
$73,045
Interest Rate
7.18%
Mortgage Type
Stand Alone First
Purchase Details
Closed on
Sep 5, 2000
Sold by
Union Planters Bank Na
Bought by
Hud
Create a Home Valuation Report for This Property
The Home Valuation Report is an in-depth analysis detailing your home's value as well as a comparison with similar homes in the area
Home Values in the Area
Average Home Value in this Area
Purchase History
| Date | Buyer | Sale Price | Title Company |
|---|---|---|---|
| Alvarado Iris | -- | None Listed On Document | |
| Alvarado Mauricio O | -- | First American Title | |
| Salazar Roger | -- | First American Title | |
| Hud | -- | -- | |
| Union Planters Bank Na | $43,736 | -- |
Source: Public Records
Mortgage History
| Date | Status | Borrower | Loan Amount |
|---|---|---|---|
| Previous Owner | Alvarado Mauricio O | $73,045 |
Source: Public Records
Tax History Compared to Growth
Tax History
| Year | Tax Paid | Tax Assessment Tax Assessment Total Assessment is a certain percentage of the fair market value that is determined by local assessors to be the total taxable value of land and additions on the property. | Land | Improvement |
|---|---|---|---|---|
| 2025 | $1,981 | $195,420 | $44,505 | $150,915 |
| 2024 | $1,981 | $195,420 | $44,505 | $150,915 |
| 2023 | $1,981 | $195,420 | $44,505 | $150,915 |
| 2022 | $2,839 | $163,244 | $35,604 | $127,640 |
| 2021 | $2,706 | $134,266 | $35,604 | $98,662 |
| 2020 | $2,592 | $114,124 | $14,242 | $99,882 |
| 2019 | $2,484 | $104,428 | $14,242 | $90,186 |
| 2018 | $1,009 | $95,736 | $14,242 | $81,494 |
| 2017 | $1,963 | $95,736 | $14,242 | $81,494 |
| 2016 | $1,784 | $88,282 | $14,242 | $74,040 |
| 2015 | $1,170 | $80,868 | $14,242 | $66,626 |
| 2014 | $1,170 | $65,070 | $14,242 | $50,828 |
Source: Public Records
Map
Nearby Homes
- 2146 Twinbrooke Dr
- 2110 Mosher Ln
- 2214 Twinbrooke Dr
- 2211 Mosher Ln
- 1907 Bunzel St
- 10642 Logger Pine Trail Unit B
- 10634 Logger Pine Trail
- 1806 Saddle Rock Dr Unit 770
- 2003 Deerhurst Ln
- 2418 Fallen Pine Ln
- 2422 Fallen Pine Ln
- 2415 Fallen Pine Ln
- 8835 Glenhouse Dr
- 9722 Willow
- 1710 Beaver Bend Rd
- 10555 Logger Pine Trail
- 2323 Hampton St
- 2200 Hampton St
- 1918 Hampton St
- 10527 Logger Pine Trail
- 2139 Beaver Bend Rd
- 2131 Beaver Bend Rd
- 2134 Twinbrooke Dr
- 2143 Beaver Bend Rd
- 2138 Twinbrooke Dr
- 2130 Twinbrooke Dr
- 2127 Beaver Bend Rd
- 2142 Twinbrooke Dr
- 2126 Twinbrooke Dr
- 2134 Beaver Bend Rd
- 2138 Beaver Bend Rd
- 2130 Beaver Bend Rd
- 2147 Beaver Bend Rd
- 2123 Beaver Bend Rd
- 2142 Beaver Bend Rd
- 2126 Beaver Bend Rd
- 2122 Twinbrooke Dr
- 2151 Beaver Bend Rd
- 2146 Beaver Bend Rd
- 2122 Beaver Bend Rd