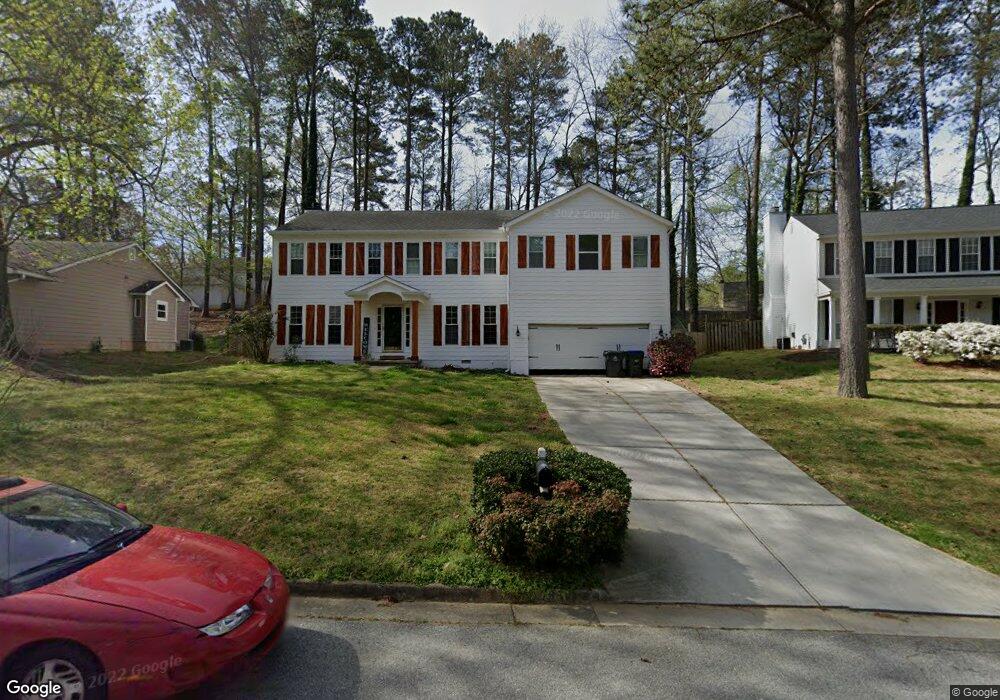
2135 Laurel Mill Way Unit 5 Roswell, GA 30076
Barrington NeighborhoodEstimated Value: $477,846 - $515,000
4
Beds
3
Baths
1,632
Sq Ft
$303/Sq Ft
Est. Value
About This Home
This home is located at 2135 Laurel Mill Way Unit 5, Roswell, GA 30076 and is currently estimated at $494,712, approximately $303 per square foot. 2135 Laurel Mill Way Unit 5 is a home located in Fulton County with nearby schools including Northwood Elementary School, Haynes Bridge Middle School, and Centennial High School.
Ownership History
Date
Name
Owned For
Owner Type
Purchase Details
Closed on
Oct 31, 2013
Sold by
Hale Robert L
Bought by
Padilla Lucy
Current Estimated Value
Home Financials for this Owner
Home Financials are based on the most recent Mortgage that was taken out on this home.
Original Mortgage
$193,431
Outstanding Balance
$143,619
Interest Rate
4.12%
Mortgage Type
FHA
Estimated Equity
$351,093
Purchase Details
Closed on
May 26, 2010
Sold by
Minchew Jeffrey J and Minchew Mary T
Bought by
Hale Robert L
Home Financials for this Owner
Home Financials are based on the most recent Mortgage that was taken out on this home.
Original Mortgage
$187,376
Interest Rate
4.87%
Mortgage Type
FHA
Purchase Details
Closed on
Aug 29, 1994
Sold by
Smith Terrence R Nancy O
Bought by
Minchew Jeffrey J Mary T
Home Financials for this Owner
Home Financials are based on the most recent Mortgage that was taken out on this home.
Original Mortgage
$101,412
Interest Rate
8.44%
Mortgage Type
FHA
Create a Home Valuation Report for This Property
The Home Valuation Report is an in-depth analysis detailing your home's value as well as a comparison with similar homes in the area
Home Values in the Area
Average Home Value in this Area
Purchase History
| Date | Buyer | Sale Price | Title Company |
|---|---|---|---|
| Padilla Lucy | $197,000 | -- | |
| Hale Robert L | $189,900 | -- | |
| Minchew Jeffrey J Mary T | $15,500 | -- |
Source: Public Records
Mortgage History
| Date | Status | Borrower | Loan Amount |
|---|---|---|---|
| Open | Padilla Lucy | $193,431 | |
| Previous Owner | Hale Robert L | $187,376 | |
| Previous Owner | Minchew Jeffrey J Mary T | $101,412 |
Source: Public Records
Tax History Compared to Growth
Tax History
| Year | Tax Paid | Tax Assessment Tax Assessment Total Assessment is a certain percentage of the fair market value that is determined by local assessors to be the total taxable value of land and additions on the property. | Land | Improvement |
|---|---|---|---|---|
| 2025 | $485 | $151,080 | $37,200 | $113,880 |
| 2023 | $4,349 | $154,080 | $37,920 | $116,160 |
| 2022 | $1,709 | $133,800 | $23,960 | $109,840 |
| 2021 | $2,058 | $112,880 | $27,320 | $85,560 |
| 2020 | $2,084 | $106,440 | $25,600 | $80,840 |
| 2019 | $377 | $104,520 | $25,120 | $79,400 |
| 2018 | $2,045 | $96,120 | $18,720 | $77,400 |
| 2017 | $1,649 | $71,600 | $11,880 | $59,720 |
| 2016 | $1,552 | $68,640 | $11,880 | $56,760 |
| 2015 | $1,932 | $68,640 | $11,880 | $56,760 |
| 2014 | $1,589 | $68,640 | $11,880 | $56,760 |
Source: Public Records
Map
Nearby Homes
- 295 Crab Orchard Way
- 780 Crab Orchard Dr
- 500 Barrington Dr W
- 105 Laurel Mill Ct
- 500 Cranberry Place Unit 6
- 485 Sheringham Ct
- 435 Sheringham Terrace
- 590 Sheringham Ct
- 680 Barrington Way
- 600 Jardin Ct Unit 48
- 2020 Jardin Ct Unit 1
- 515 Forest Place
- 650 Lake Forest Ct
- 620 Lake Forest Ct
- 1095 Northpointe Trace
- 9985 Lake Forest Way
- 115 Ansley Ct
- 105 May Glen Way
- 2135 Laurel Mill Way Unit 231
- 2135 Laurel Mill Way
- 2125 Laurel Mill Way
- 2145 Laurel Mill Way
- 130 Laurel Mill Terrace
- 375 Barrington Dr E Unit 5
- 385 Barrington Dr E
- 2115 Laurel Mill Way
- 2130 Laurel Mill Way
- 365 Barrington Dr E Unit 5
- 395 Barrington Dr E
- 0 Laurel Mill Terrace Unit 7029191
- 2140 Laurel Mill Way
- 2105 Laurel Mill Way Unit 5
- 2175 Laurel Mill Way Unit 5
- 135 Laurel Mill Terrace
- 2150 Laurel Mill Way Unit 5
- 355 Barrington Dr E
- 125 Laurel Mill Terrace Unit 5
- 415 Barrington Dr E Unit 5