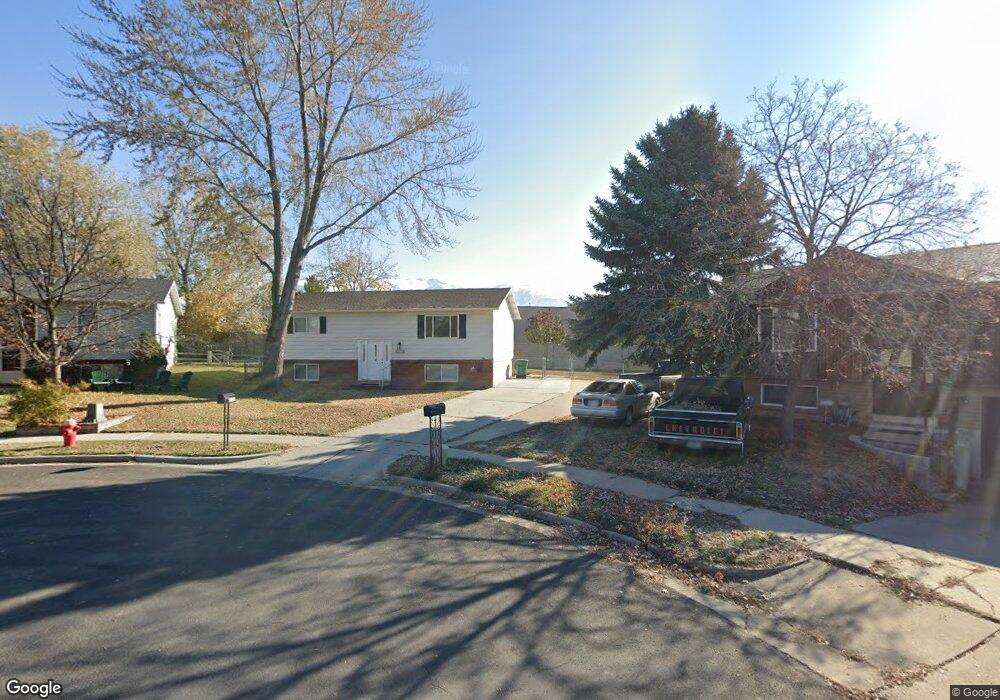
2135 N 1050 W Layton, UT 84041
Estimated Value: $408,000 - $456,370
3
Beds
2
Baths
1,880
Sq Ft
$229/Sq Ft
Est. Value
About This Home
This home is located at 2135 N 1050 W, Layton, UT 84041 and is currently estimated at $430,593, approximately $229 per square foot. 2135 N 1050 W is a home located in Davis County with nearby schools including Lincoln Elementary School, North Layton Junior High School, and Northridge High School.
Ownership History
Date
Name
Owned For
Owner Type
Purchase Details
Closed on
Aug 24, 2020
Sold by
Hart Bonnie M
Bought by
Hart Bonnie M and Robison Brenda
Current Estimated Value
Purchase Details
Closed on
May 18, 2006
Sold by
York Earnest W and York Sherry J
Bought by
Hart Bonnie M
Home Financials for this Owner
Home Financials are based on the most recent Mortgage that was taken out on this home.
Original Mortgage
$112,004
Outstanding Balance
$64,905
Interest Rate
6.41%
Mortgage Type
Fannie Mae Freddie Mac
Estimated Equity
$365,688
Purchase Details
Closed on
Dec 14, 1998
Sold by
Frederick Sherry J
Bought by
York Earnest W and York Sherry J
Home Financials for this Owner
Home Financials are based on the most recent Mortgage that was taken out on this home.
Original Mortgage
$78,000
Interest Rate
6.86%
Create a Home Valuation Report for This Property
The Home Valuation Report is an in-depth analysis detailing your home's value as well as a comparison with similar homes in the area
Home Values in the Area
Average Home Value in this Area
Purchase History
| Date | Buyer | Sale Price | Title Company |
|---|---|---|---|
| Hart Bonnie M | -- | First American Title | |
| Hart Bonnie M | -- | Equity Title Ins Agency Inc | |
| York Earnest W | -- | Backman Stewart Title Servic |
Source: Public Records
Mortgage History
| Date | Status | Borrower | Loan Amount |
|---|---|---|---|
| Open | Hart Bonnie M | $112,004 | |
| Previous Owner | York Earnest W | $78,000 |
Source: Public Records
Tax History Compared to Growth
Tax History
| Year | Tax Paid | Tax Assessment Tax Assessment Total Assessment is a certain percentage of the fair market value that is determined by local assessors to be the total taxable value of land and additions on the property. | Land | Improvement |
|---|---|---|---|---|
| 2024 | $1,898 | $200,750 | $147,459 | $53,291 |
| 2023 | $1,883 | $351,000 | $163,343 | $187,657 |
| 2022 | $1,945 | $196,900 | $89,876 | $107,024 |
| 2021 | $1,769 | $267,000 | $135,919 | $131,081 |
| 2020 | $1,595 | $231,000 | $110,145 | $120,855 |
| 2019 | $1,615 | $229,000 | $100,906 | $128,094 |
| 2018 | $1,461 | $208,000 | $100,906 | $107,094 |
| 2016 | $1,161 | $85,305 | $34,932 | $50,373 |
| 2015 | $1,187 | $82,768 | $34,932 | $47,836 |
| 2014 | $975 | $69,553 | $34,932 | $34,621 |
| 2013 | -- | $77,550 | $21,264 | $56,286 |
Source: Public Records
Map
Nearby Homes
- 781 W 2150 N
- 2402 N 725 W
- 2378 N 675 W
- 2211 N 525 W
- 2187 N 450 W
- 1094 N Angel St W
- 1837 N 440 W
- 1413 W 1650 N
- 1615 N Angel St Unit E
- 1615 N Angel St Unit H
- 1615 N Angel St Unit I
- 1615 N Angel St Unit F
- 1615 N Angel St Unit G
- 1615 N Angel St
- 1615 N Angel St Unit D
- 1615 N Angel St Unit C
- 1615 N Angel St Unit B
- 1615 N Angel St Unit A
- 1500 N Angel St Unit 12
- 1500 N Angel St Unit 64