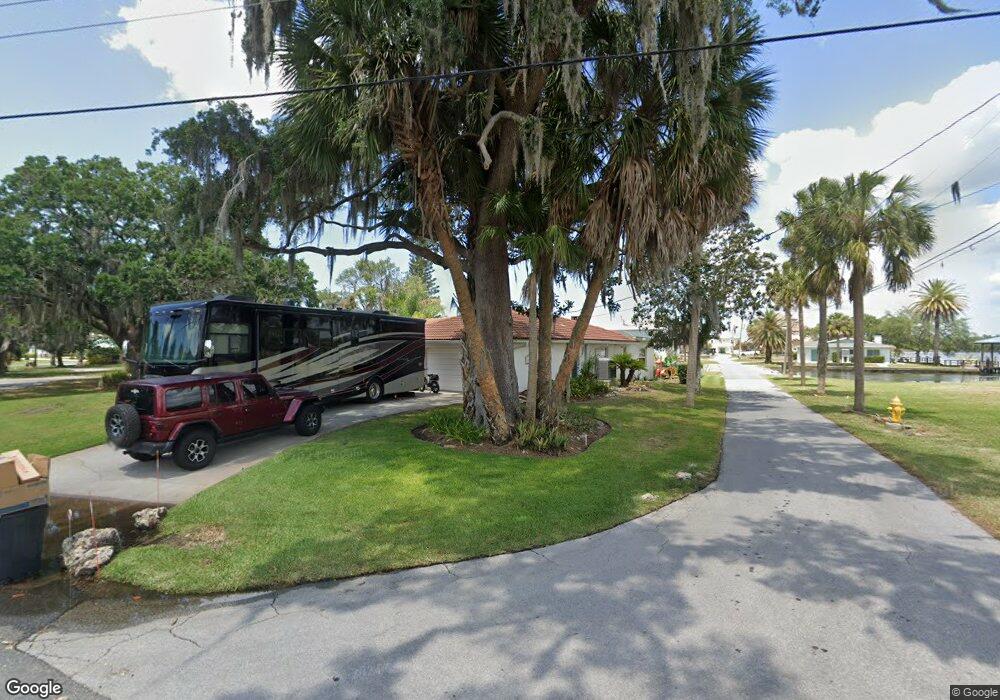
2135 N Watersedge Dr Crystal River, FL 34429
Estimated Value: $612,099 - $707,000
2
Beds
2
Baths
2,004
Sq Ft
$323/Sq Ft
Est. Value
About This Home
This home is located at 2135 N Watersedge Dr, Crystal River, FL 34429 and is currently estimated at $647,025, approximately $322 per square foot. 2135 N Watersedge Dr is a home located in Citrus County with nearby schools including Crystal River Primary School, Crystal River High School, and Crystal River Middle School.
Ownership History
Date
Name
Owned For
Owner Type
Purchase Details
Closed on
May 6, 2015
Sold by
Cipriani Mario and Cipriani Marie T
Bought by
Geeding Steven C and Burns Randall E
Current Estimated Value
Home Financials for this Owner
Home Financials are based on the most recent Mortgage that was taken out on this home.
Original Mortgage
$240,000
Outstanding Balance
$184,290
Interest Rate
3.75%
Mortgage Type
New Conventional
Estimated Equity
$462,735
Purchase Details
Closed on
May 1, 1998
Bought by
Geeding Steven C and Geeding Janice
Purchase Details
Closed on
Feb 1, 1991
Bought by
Geeding Steven C and Geeding Janice
Purchase Details
Closed on
May 1, 1989
Bought by
Geeding Steven C and Geeding Janice
Purchase Details
Closed on
Dec 1, 1986
Bought by
Geeding Steven C and Geeding Janice
Purchase Details
Closed on
Sep 1, 1984
Bought by
Geeding Steven C and Geeding Janice
Purchase Details
Closed on
Sep 1, 1979
Bought by
Geeding Steven C and Geeding Janice
Create a Home Valuation Report for This Property
The Home Valuation Report is an in-depth analysis detailing your home's value as well as a comparison with similar homes in the area
Home Values in the Area
Average Home Value in this Area
Purchase History
| Date | Buyer | Sale Price | Title Company |
|---|---|---|---|
| Geeding Steven C | $300,000 | Title Usa Llc | |
| Geeding Steven C | $156,500 | -- | |
| Geeding Steven C | $100 | -- | |
| Geeding Steven C | $160,000 | -- | |
| Geeding Steven C | $100 | -- | |
| Geeding Steven C | $100 | -- | |
| Geeding Steven C | $34,000 | -- |
Source: Public Records
Mortgage History
| Date | Status | Borrower | Loan Amount |
|---|---|---|---|
| Open | Geeding Steven C | $240,000 |
Source: Public Records
Tax History
| Year | Tax Paid | Tax Assessment Tax Assessment Total Assessment is a certain percentage of the fair market value that is determined by local assessors to be the total taxable value of land and additions on the property. | Land | Improvement |
|---|---|---|---|---|
| 2025 | $7,181 | $529,588 | $237,000 | $292,588 |
| 2024 | $6,734 | $542,689 | $237,000 | $305,689 |
| 2023 | $6,734 | $516,005 | $221,200 | $294,805 |
| 2022 | $6,035 | $484,699 | $189,600 | $295,099 |
| 2021 | $5,110 | $376,721 | $177,750 | $198,971 |
| 2020 | $4,412 | $296,433 | $107,840 | $188,593 |
| 2019 | $4,604 | $305,283 | $106,650 | $198,633 |
| 2018 | $4,279 | $280,128 | $106,650 | $173,478 |
| 2017 | $3,968 | $252,126 | $117,180 | $134,946 |
| 2016 | $4,489 | $275,016 | $112,003 | $163,013 |
| 2015 | $2,188 | $167,599 | $112,003 | $55,596 |
| 2014 | -- | $166,269 | $111,449 | $54,820 |
Source: Public Records
Map
Nearby Homes
- 2160 N Watersedge Dr
- 2235 Kings Cove Point N
- 2235 N Kings Cove Point
- 2176 N Watersedge Dr
- 2243 N Kings Cove Point
- 2184 N Watersedge Dr
- 2225 N Watersedge Dr
- 10453 W Sea Dr
- 2262 N Watersedge Dr
- 10748 W Pine Bark Ln
- 547 W Fort Island Trail
- 363 NW 14th Place
- 371 NW 14th Place
- 2380 N Watersedge Dr
- 2435 N Watersedge Dr
- 362 NW 14th Place Unit 21
- 300 NW 12th Ave
- 381 NW Magnolia Cir
- 571 NW 14th Place
- 566 NW Magnolia Cir
- 2141 N Watersedge Dr
- 0 N Kings Cove Point
- 2113 N Watersedge Dr
- 2147 N Watersedge Dr
- 2136 N Watersedge Dr
- 2142 N Watersedge Dr
- 2123 N Watersedge Dr
- 2130 N Watersedge Dr
- 2195 N Kings Cove Point
- 2148 N Watersedge Dr
- 2155 N Watersedge Dr
- 2190 N Kings Cove Point
- 2124 N Watersedge Dr
- 2186 N Pilot Point
- 2205 N Kings Cove Point
- 2118 N Watersedge Dr
- 2208 N Kings Cove Point
- 2181 N Pilot Point
- 2171 N Watersedge Dr
- 2221 N Kings Cove Point
Your Personal Tour Guide
Ask me questions while you tour the home.