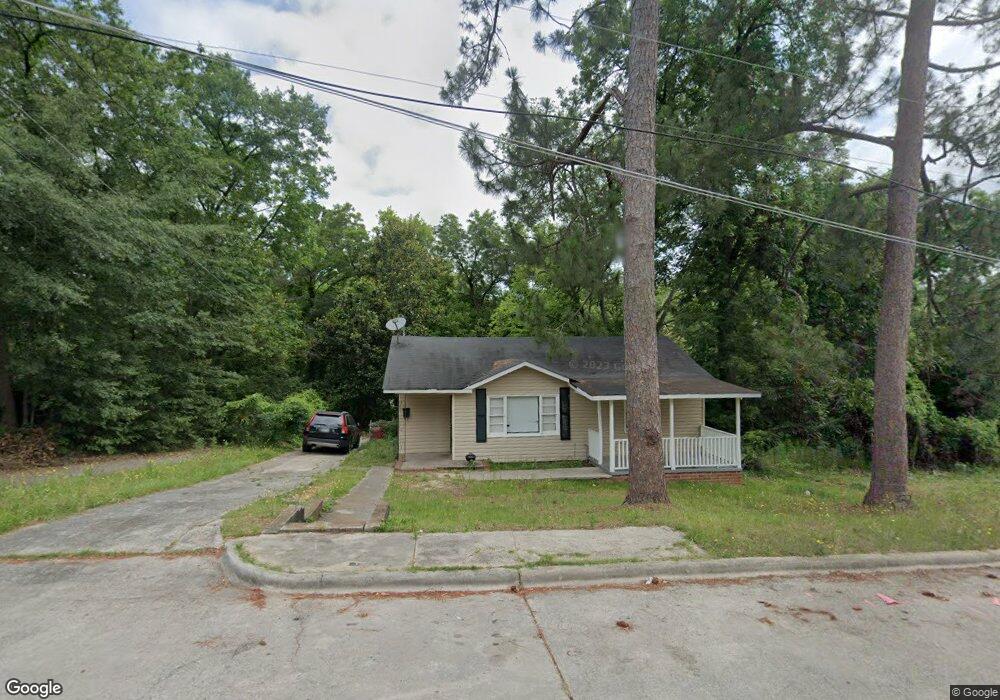
2135 Neal Ave Macon, GA 31204
Estimated Value: $90,000 - $129,000
4
Beds
2
Baths
1,338
Sq Ft
$83/Sq Ft
Est. Value
About This Home
This home is located at 2135 Neal Ave, Macon, GA 31204 and is currently estimated at $110,819, approximately $82 per square foot. 2135 Neal Ave is a home located in Bibb County with nearby schools including Williams Elementary School, Miller Fine Arts Magnet Middle School, and Central High School.
Ownership History
Date
Name
Owned For
Owner Type
Purchase Details
Closed on
Dec 14, 2023
Sold by
Ghenassia Michael and Ghenassia Daniele
Bought by
Series 35 Of Mylbarney Llc
Current Estimated Value
Purchase Details
Closed on
Feb 26, 2009
Sold by
Homesales Inc
Bought by
Hannah William P
Purchase Details
Closed on
Dec 2, 2008
Sold by
Green Jason D
Bought by
Homesales Inc
Purchase Details
Closed on
Jul 13, 2007
Sold by
Park James
Bought by
Green Jason D
Home Financials for this Owner
Home Financials are based on the most recent Mortgage that was taken out on this home.
Original Mortgage
$62,050
Interest Rate
6.71%
Mortgage Type
Purchase Money Mortgage
Purchase Details
Closed on
Dec 28, 2004
Purchase Details
Closed on
Nov 18, 2004
Purchase Details
Closed on
Nov 5, 2004
Create a Home Valuation Report for This Property
The Home Valuation Report is an in-depth analysis detailing your home's value as well as a comparison with similar homes in the area
Home Values in the Area
Average Home Value in this Area
Purchase History
| Date | Buyer | Sale Price | Title Company |
|---|---|---|---|
| Series 35 Of Mylbarney Llc | -- | None Listed On Document | |
| Series 35 Of Mylbarney Llc | -- | None Listed On Document | |
| Ghenassia Michael | -- | None Listed On Document | |
| Ghenassia Michael | -- | None Listed On Document | |
| Hannah William P | $14,900 | None Available | |
| Homesales Inc | $69,500 | -- | |
| Homesales Inc | $69,521 | None Available | |
| Green Jason D | $73,000 | None Available | |
| -- | $25,000 | -- | |
| -- | -- | -- | |
| -- | $16,000 | -- |
Source: Public Records
Mortgage History
| Date | Status | Borrower | Loan Amount |
|---|---|---|---|
| Previous Owner | Green Jason D | $62,050 |
Source: Public Records
Tax History Compared to Growth
Tax History
| Year | Tax Paid | Tax Assessment Tax Assessment Total Assessment is a certain percentage of the fair market value that is determined by local assessors to be the total taxable value of land and additions on the property. | Land | Improvement |
|---|---|---|---|---|
| 2025 | $548 | $22,319 | $2,916 | $19,403 |
| 2024 | $545 | $21,451 | $2,430 | $19,021 |
| 2023 | $629 | $26,749 | $2,025 | $24,724 |
| 2022 | $618 | $17,856 | $1,502 | $16,354 |
| 2021 | $666 | $17,525 | $1,502 | $16,023 |
| 2020 | $679 | $17,494 | $1,502 | $15,992 |
| 2019 | $671 | $17,145 | $1,766 | $15,379 |
| 2018 | $1,028 | $17,145 | $1,766 | $15,379 |
| 2017 | $642 | $17,145 | $1,766 | $15,379 |
| 2016 | $593 | $17,145 | $1,766 | $15,379 |
| 2015 | $961 | $19,630 | $1,766 | $17,863 |
| 2014 | $1,138 | $20,215 | $1,766 | $18,448 |
Source: Public Records
Map
Nearby Homes