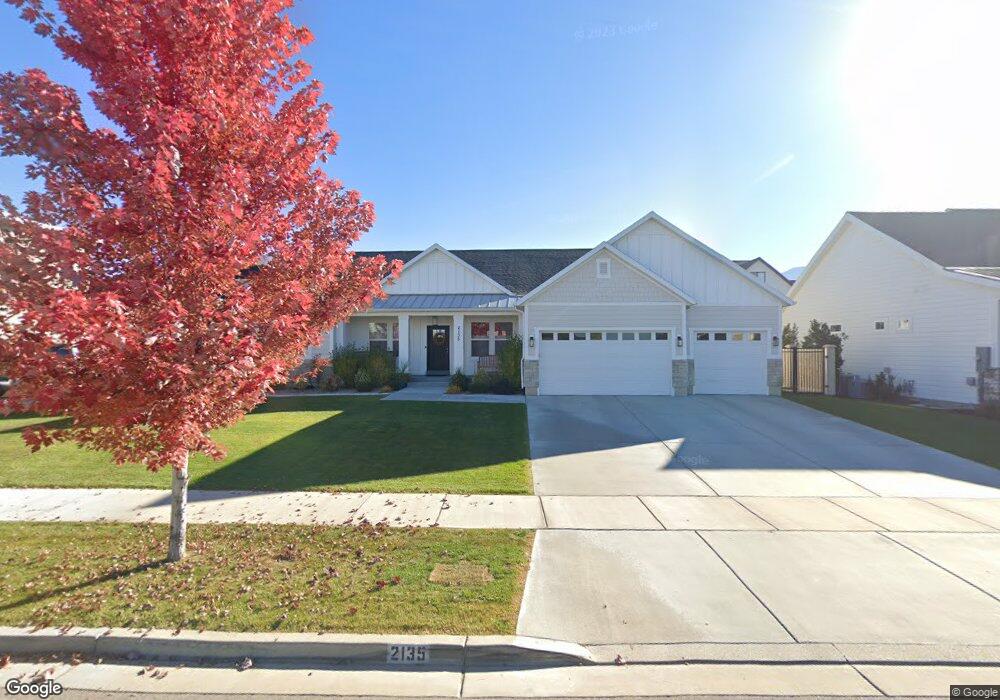
2135 S 60 W Orem, UT 84058
Lakeview NeighborhoodEstimated Value: $942,000 - $1,102,892
5
Beds
4
Baths
4,476
Sq Ft
$235/Sq Ft
Est. Value
About This Home
This home is located at 2135 S 60 W, Orem, UT 84058 and is currently estimated at $1,053,473, approximately $235 per square foot. 2135 S 60 W is a home located in Utah County with nearby schools including Cherry Hill Elementary School, Lakeridge Jr High School, and Mountain View High School.
Ownership History
Date
Name
Owned For
Owner Type
Purchase Details
Closed on
Aug 18, 2021
Sold by
Penman Jeffrey Allen and Penman Gail Ann
Bought by
Penman Jeffrey Allen and Penman Gail Ann
Current Estimated Value
Purchase Details
Closed on
Sep 21, 2017
Sold by
Davis Colin and Pulsipher Cory
Bought by
Penman Jeffrey Allen and Penman Gail Ann
Home Financials for this Owner
Home Financials are based on the most recent Mortgage that was taken out on this home.
Original Mortgage
$415,000
Outstanding Balance
$346,554
Interest Rate
3.9%
Mortgage Type
New Conventional
Estimated Equity
$706,919
Purchase Details
Closed on
Jan 24, 2017
Sold by
Legacy Ridge Llc
Bought by
Davis Colin and Pulsipher Cory
Create a Home Valuation Report for This Property
The Home Valuation Report is an in-depth analysis detailing your home's value as well as a comparison with similar homes in the area
Home Values in the Area
Average Home Value in this Area
Purchase History
| Date | Buyer | Sale Price | Title Company |
|---|---|---|---|
| Penman Jeffrey Allen | -- | None Available | |
| Penman Jeffrey Allen | -- | Us Title Insurance Agency | |
| Davis Colin | -- | Access Title Co |
Source: Public Records
Mortgage History
| Date | Status | Borrower | Loan Amount |
|---|---|---|---|
| Open | Penman Jeffrey Allen | $415,000 | |
| Closed | Davis Colin | $0 |
Source: Public Records
Tax History
| Year | Tax Paid | Tax Assessment Tax Assessment Total Assessment is a certain percentage of the fair market value that is determined by local assessors to be the total taxable value of land and additions on the property. | Land | Improvement |
|---|---|---|---|---|
| 2025 | $4,080 | $539,550 | -- | -- |
| 2024 | $4,080 | $498,850 | $0 | $0 |
| 2023 | $3,820 | $502,040 | $0 | $0 |
| 2022 | $3,695 | $470,470 | $0 | $0 |
| 2021 | $3,293 | $635,000 | $212,300 | $422,700 |
| 2020 | $3,098 | $587,200 | $184,600 | $402,600 |
| 2019 | $2,903 | $572,100 | $184,600 | $387,500 |
| 2018 | $2,896 | $545,300 | $184,600 | $360,700 |
| 2017 | $1,720 | $173,500 | $0 | $0 |
| 2016 | $1,865 | $173,500 | $0 | $0 |
Source: Public Records
Map
Nearby Homes
Your Personal Tour Guide
Ask me questions while you tour the home.