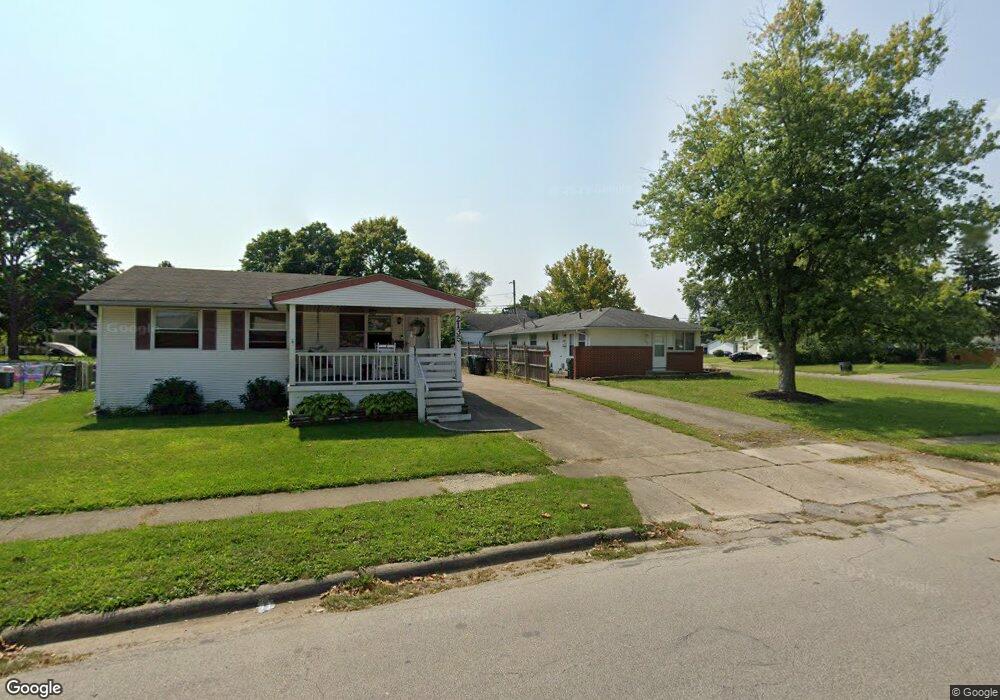
2135 Tupsfield Rd Columbus, OH 43229
Forest Park East NeighborhoodEstimated Value: $204,000 - $233,000
4
Beds
1
Bath
896
Sq Ft
$248/Sq Ft
Est. Value
About This Home
This home is located at 2135 Tupsfield Rd, Columbus, OH 43229 and is currently estimated at $222,208, approximately $248 per square foot. 2135 Tupsfield Rd is a home located in Franklin County with nearby schools including Avalon Elementary School, Northgate Intermediate, and Woodward Park Middle School.
Ownership History
Date
Name
Owned For
Owner Type
Purchase Details
Closed on
Jan 12, 2009
Sold by
Liebhart Tim and Liebhart Anita
Bought by
Liston Beth W
Current Estimated Value
Home Financials for this Owner
Home Financials are based on the most recent Mortgage that was taken out on this home.
Original Mortgage
$79,600
Outstanding Balance
$50,131
Interest Rate
5.44%
Mortgage Type
Purchase Money Mortgage
Estimated Equity
$172,077
Purchase Details
Closed on
Sep 19, 2008
Sold by
Bank Of New York
Bought by
Liebhart Tim
Purchase Details
Closed on
Jul 9, 2008
Sold by
Davis Jamie and Case #07Cve04 4834
Bought by
Bank Of New York and Certificateholders Cwabs 2003-05
Purchase Details
Closed on
Sep 25, 2003
Sold by
Butera Holly L and Moore Kelly W
Bought by
Davis Jamie
Home Financials for this Owner
Home Financials are based on the most recent Mortgage that was taken out on this home.
Original Mortgage
$117,000
Interest Rate
7.75%
Mortgage Type
Purchase Money Mortgage
Create a Home Valuation Report for This Property
The Home Valuation Report is an in-depth analysis detailing your home's value as well as a comparison with similar homes in the area
Home Values in the Area
Average Home Value in this Area
Purchase History
| Date | Buyer | Sale Price | Title Company |
|---|---|---|---|
| Liston Beth W | $99,500 | Stewart Tit | |
| Liebhart Tim | $48,500 | Cornerston | |
| Bank Of New York | $78,000 | None Available | |
| Davis Jamie | $117,000 | -- |
Source: Public Records
Mortgage History
| Date | Status | Borrower | Loan Amount |
|---|---|---|---|
| Open | Liston Beth W | $79,600 | |
| Previous Owner | Davis Jamie | $117,000 |
Source: Public Records
Tax History
| Year | Tax Paid | Tax Assessment Tax Assessment Total Assessment is a certain percentage of the fair market value that is determined by local assessors to be the total taxable value of land and additions on the property. | Land | Improvement |
|---|---|---|---|---|
| 2025 | $3,099 | $67,630 | $17,750 | $49,880 |
| 2024 | $3,099 | $67,630 | $17,750 | $49,880 |
| 2023 | $3,061 | $67,630 | $17,750 | $49,880 |
| 2022 | $2,256 | $42,460 | $10,680 | $31,780 |
| 2021 | $2,260 | $42,460 | $10,680 | $31,780 |
| 2020 | $2,264 | $42,460 | $10,680 | $31,780 |
| 2019 | $1,979 | $31,820 | $7,910 | $23,910 |
| 2018 | $1,961 | $31,820 | $7,910 | $23,910 |
| 2017 | $1,978 | $31,820 | $7,910 | $23,910 |
| 2016 | $2,084 | $30,670 | $7,460 | $23,210 |
| 2015 | $1,947 | $30,670 | $7,460 | $23,210 |
| 2014 | $1,902 | $30,670 | $7,460 | $23,210 |
| 2013 | $1,037 | $32,270 | $7,840 | $24,430 |
Source: Public Records
Map
Nearby Homes
- 5732 Beechcroft Rd Unit B
- 5491 Parkshire Dr Unit 5491
- 5556 Parkshire Dr Unit 5556
- 5720 Beechcroft Rd Unit B
- 2294 Teakwood Dr
- 5885 Beechcroft Rd Unit 306
- 5885 Beechcroft Rd Unit 313
- 5705 Tamarack Blvd Unit F
- 6019 Beechcroft Rd
- 5486 Pine Bluff Rd
- 1687 Brookfield Square S
- 2470 Carolina Ave Unit 66
- 6048 Pinemoor St
- 2251 Tuliptree Ave
- 2259 Tuliptree Ave
- 2292 Laurelwood Dr Unit 2292L
- 2688 Woodley Rd
- 6148 Sharon Woods Blvd
- 2197 Bayfield Dr
- 2236 Strimple Ave
- 5614 Maple Canyon Ave
- 2143 Tupsfield Rd
- 2127 Tupsfield Rd
- 2149 Tupsfield Rd
- 2136 Shawbury Ct E
- 2128 Shawbury Ct E
- 2142 Shawbury Ct E
- 5600 Maple Canyon Ave Unit 602
- 2155 Tupsfield Rd
- 2128 Tupsfield Rd
- 2150 Shawbury Ct E
- 2136 Tupsfield Rd
- 2140 Tupsfield Rd
- 2144 Tupsfield Rd
- 5634 Maple Canyon Ave
- 2156 Shawbury Ct E
- 5619 Maple Canyon Ave
- 2150 Tupsfield Rd
- 2163 Tupsfield Rd
- 2156 Tupsfield Rd
Your Personal Tour Guide
Ask me questions while you tour the home.