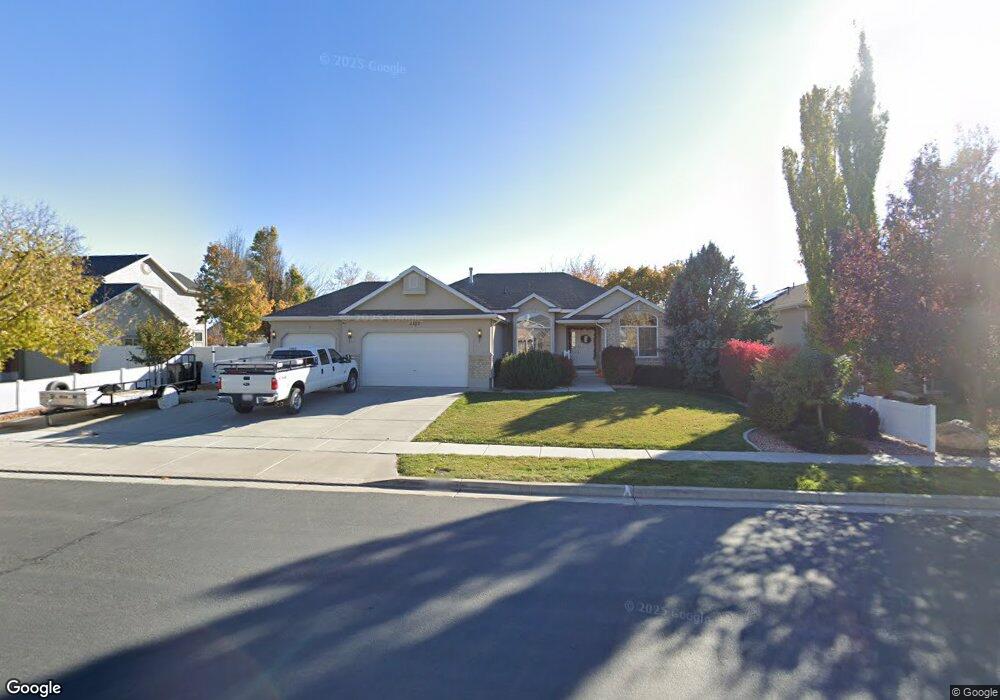
2135 W 2200 S Syracuse, UT 84075
Estimated Value: $625,000 - $702,000
5
Beds
3
Baths
3,166
Sq Ft
$205/Sq Ft
Est. Value
About This Home
This home is located at 2135 W 2200 S, Syracuse, UT 84075 and is currently estimated at $649,376, approximately $205 per square foot. 2135 W 2200 S is a home located in Davis County with nearby schools including Syracuse Elementary School, Syracuse Junior High School, and Syracuse High School.
Ownership History
Date
Name
Owned For
Owner Type
Purchase Details
Closed on
Dec 10, 2020
Sold by
Shoemaker Jeremy K
Bought by
Shoemaker Jeremy Kent
Current Estimated Value
Home Financials for this Owner
Home Financials are based on the most recent Mortgage that was taken out on this home.
Original Mortgage
$337,300
Outstanding Balance
$299,605
Interest Rate
2.7%
Mortgage Type
New Conventional
Estimated Equity
$349,771
Purchase Details
Closed on
Sep 26, 2018
Sold by
Warlaumont Derrick Robert and Warlaumont Hollie
Bought by
Shoemaker Jeremy K
Home Financials for this Owner
Home Financials are based on the most recent Mortgage that was taken out on this home.
Original Mortgage
$312,000
Interest Rate
4.5%
Mortgage Type
New Conventional
Purchase Details
Closed on
May 5, 2017
Sold by
Warlaumont Derrick R and Warlaumont Hollie T
Bought by
Warlaumont Trust
Purchase Details
Closed on
Jun 24, 2013
Sold by
Warlaumont Derrick R and Warlaumont Hollie T
Bought by
Warlaumont Derrick and Warlaumont Hollie
Home Financials for this Owner
Home Financials are based on the most recent Mortgage that was taken out on this home.
Original Mortgage
$178,596
Interest Rate
2.73%
Mortgage Type
New Conventional
Purchase Details
Closed on
Aug 8, 2008
Sold by
Northern Regal Homes Inc
Bought by
Wariaumont Derrick R and Wariaumont Hollie T
Purchase Details
Closed on
Nov 25, 2003
Sold by
Williams Gary L
Bought by
Warlaumont Derrick R and Warlaumont Hollie T
Home Financials for this Owner
Home Financials are based on the most recent Mortgage that was taken out on this home.
Original Mortgage
$184,800
Interest Rate
6%
Mortgage Type
Purchase Money Mortgage
Purchase Details
Closed on
Aug 20, 2003
Sold by
Williams Gary L
Bought by
Northern Regal Homes Inc
Purchase Details
Closed on
Feb 7, 2003
Sold by
Holtry Construction Inc
Bought by
Northern Regal Homes Inc
Home Financials for this Owner
Home Financials are based on the most recent Mortgage that was taken out on this home.
Original Mortgage
$180,800
Interest Rate
10%
Purchase Details
Closed on
Feb 6, 2003
Sold by
Northern Regal Homes Inc
Bought by
Williams Gary L
Home Financials for this Owner
Home Financials are based on the most recent Mortgage that was taken out on this home.
Original Mortgage
$180,800
Interest Rate
10%
Create a Home Valuation Report for This Property
The Home Valuation Report is an in-depth analysis detailing your home's value as well as a comparison with similar homes in the area
Home Values in the Area
Average Home Value in this Area
Purchase History
| Date | Buyer | Sale Price | Title Company |
|---|---|---|---|
| Shoemaker Jeremy Kent | -- | Premium Title & Escrow Inc | |
| Shoemaker Jeremy K | -- | Backman Title Services | |
| Warlaumont Trust | -- | -- | |
| Warlaumont Derrick | -- | None Available | |
| Wariaumont Derrick R | -- | Heritage West Title Ins Agen | |
| Warlaumont Derrick R | -- | Heritage West Title Ins | |
| Northern Regal Homes Inc | -- | Mountain View Title & Escrow | |
| Northern Regal Homes Inc | -- | Mountain View Title & Escrow | |
| Williams Gary L | -- | Mountain View Title & Escrow |
Source: Public Records
Mortgage History
| Date | Status | Borrower | Loan Amount |
|---|---|---|---|
| Open | Shoemaker Jeremy Kent | $337,300 | |
| Closed | Shoemaker Jeremy K | $312,000 | |
| Previous Owner | Warlaumont Derrick | $178,596 | |
| Previous Owner | Warlaumont Derrick R | $184,800 | |
| Previous Owner | Williams Gary L | $180,800 |
Source: Public Records
Tax History Compared to Growth
Tax History
| Year | Tax Paid | Tax Assessment Tax Assessment Total Assessment is a certain percentage of the fair market value that is determined by local assessors to be the total taxable value of land and additions on the property. | Land | Improvement |
|---|---|---|---|---|
| 2025 | $3,409 | $328,900 | $128,486 | $200,414 |
| 2024 | $3,256 | $316,250 | $109,715 | $206,535 |
| 2023 | $3,130 | $554,000 | $152,674 | $401,326 |
| 2022 | $3,361 | $326,150 | $87,406 | $238,744 |
| 2021 | $2,943 | $442,000 | $129,562 | $312,438 |
| 2020 | $2,634 | $383,000 | $111,124 | $271,876 |
| 2019 | $2,529 | $363,000 | $110,748 | $252,252 |
| 2018 | $2,358 | $336,000 | $105,810 | $230,190 |
| 2016 | $2,093 | $156,420 | $40,534 | $115,886 |
| 2015 | $2,032 | $144,650 | $40,534 | $104,116 |
| 2014 | $1,966 | $142,569 | $40,534 | $102,035 |
| 2013 | -- | $140,620 | $36,623 | $103,997 |
Source: Public Records
Map
Nearby Homes
- 2136 W 2200 S
- 2104 W 2200 S
- 2297 W 2175 S
- 2047 S 2000 W
- 1932 S 2150 W
- 1836 W 2400 S
- 2194 S 1800 W
- 2503 S 1875 W
- 2208 W 2615 S Unit 141
- 2198 W 2615 S Unit 140
- 2158 W 2615 S Unit 137
- 2650 S 2000 W
- 1918 S 2465 W
- 2000 S 1800 W
- 4344 W 1825 S Unit 102
- 4354 W 1825 S Unit 104
- 4348 W 1825 S Unit 103
- 2402 W 2700 S
- 2082 S 1730 W
- Bridgeport Plan at Sadie's Glenn