Estimated Value: $387,000 - $424,000
4
Beds
3
Baths
2,310
Sq Ft
$179/Sq Ft
Est. Value
About This Home
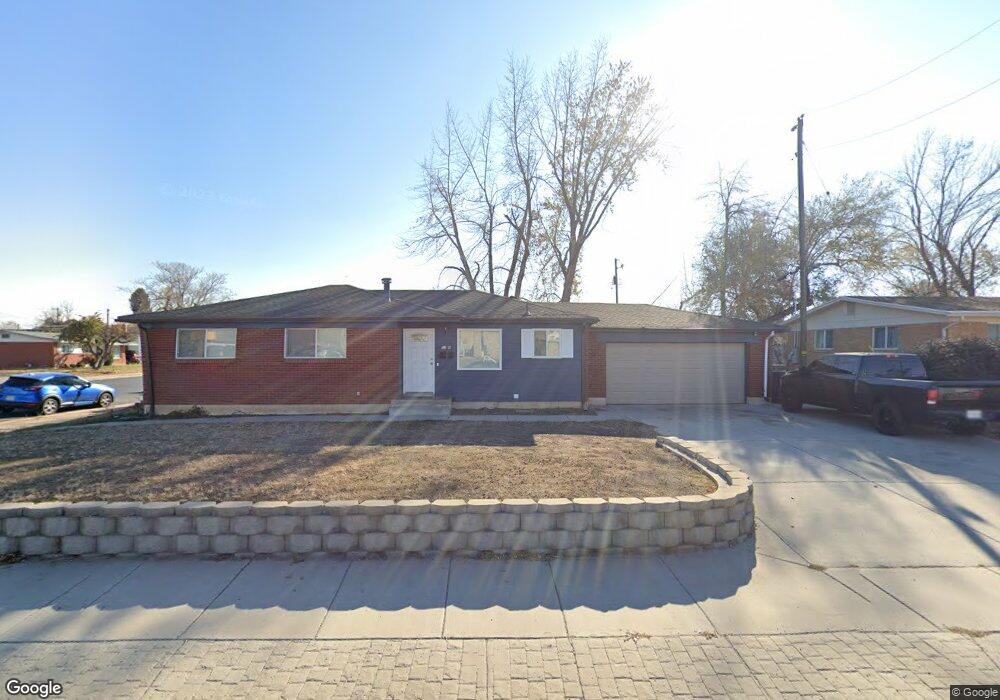
This home is located at 2135 W 4800 S, Roy, UT 84067 and is currently estimated at $412,547, approximately $178 per square foot. 2135 W 4800 S is a home located in Weber County with nearby schools including Lakeview Elementary School, Roy Junior High School, and Roy High School.
Ownership History
Date
Name
Owned For
Owner Type
Purchase Details
Closed on
Jan 20, 2022
Sold by
Brenton Ray
Bought by
Conley Owen Robert
Current Estimated Value
Home Financials for this Owner
Home Financials are based on the most recent Mortgage that was taken out on this home.
Original Mortgage
$398,970
Outstanding Balance
$369,306
Interest Rate
3.45%
Mortgage Type
VA
Estimated Equity
$43,241
Purchase Details
Closed on
May 30, 2014
Sold by
Anderson Lori J
Bought by
Truman Marketing Llc
Home Financials for this Owner
Home Financials are based on the most recent Mortgage that was taken out on this home.
Original Mortgage
$86,970
Interest Rate
4.23%
Mortgage Type
Purchase Money Mortgage
Purchase Details
Closed on
Feb 27, 2001
Sold by
Woolsey Grant J
Bought by
Woolsey Grant J and Woolsey Lindsay R
Create a Home Valuation Report for This Property
The Home Valuation Report is an in-depth analysis detailing your home's value as well as a comparison with similar homes in the area
Home Values in the Area
Average Home Value in this Area
Purchase History
| Date | Buyer | Sale Price | Title Company |
|---|---|---|---|
| Conley Owen Robert | -- | Stewart Title Company | |
| Truman Marketing Llc | -- | Charger Title | |
| Woolsey Grant J | -- | Security Title |
Source: Public Records
Mortgage History
| Date | Status | Borrower | Loan Amount |
|---|---|---|---|
| Open | Conley Owen Robert | $398,970 | |
| Previous Owner | Truman Marketing Llc | $86,970 |
Source: Public Records
Tax History
| Year | Tax Paid | Tax Assessment Tax Assessment Total Assessment is a certain percentage of the fair market value that is determined by local assessors to be the total taxable value of land and additions on the property. | Land | Improvement |
|---|---|---|---|---|
| 2025 | $2,513 | $396,559 | $102,000 | $294,559 |
| 2024 | $2,381 | $207,349 | $56,100 | $151,249 |
| 2023 | $2,352 | $205,700 | $53,680 | $152,020 |
| 2022 | $2,468 | $223,300 | $49,091 | $174,209 |
| 2021 | $1,919 | $283,000 | $59,495 | $223,505 |
| 2020 | $1,756 | $237,000 | $59,495 | $177,505 |
| 2019 | $1,645 | $208,000 | $34,016 | $173,984 |
| 2018 | $1,485 | $175,000 | $31,460 | $143,540 |
| 2017 | $1,392 | $153,000 | $31,460 | $121,540 |
| 2016 | $1,352 | $79,941 | $16,167 | $63,774 |
| 2015 | $1,318 | $80,170 | $16,167 | $64,003 |
| 2014 | $1,259 | $75,245 | $13,736 | $61,509 |
Source: Public Records
Map
Nearby Homes
- 2153 W 4800 S
- 4851 S 2075 W
- 2038 W 4600 S
- 4533 S 2075 W
- 2266 W 5100 S
- 1838 W 5050 S
- 4642 S 1900 W Unit 41
- 1829 W 5050 S
- 5185 S 2100 W
- 5006 S 1800 W
- 1789 W 5000 S
- 1783 W 5000 S
- 4602 Hathaway Dr
- 4539 S 1800 W Unit 127
- 1789 W 5050 S
- 4536 S 1900 W Unit 12
- 1765 W 5000 S
- 5243 S 2200 W
- 1779 W 5125 S
- 5261 S 2200 W