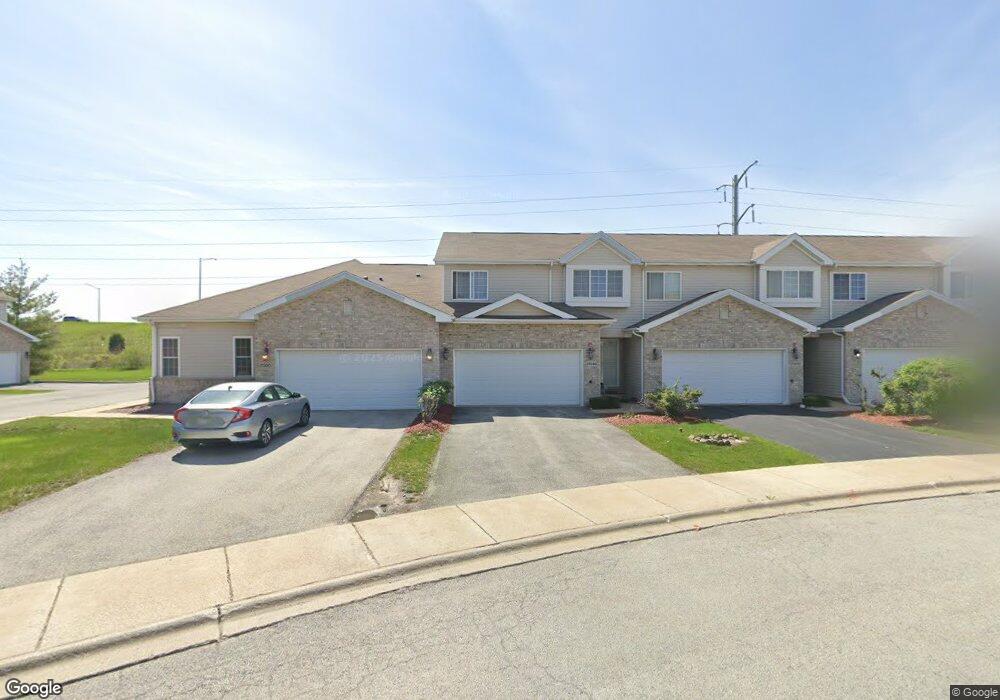
21350 Knightbridge Ct Matteson, IL 60443
Old Matteson NeighborhoodEstimated Value: $259,546 - $280,000
3
Beds
2
Baths
1,565
Sq Ft
$172/Sq Ft
Est. Value
About This Home
This home is located at 21350 Knightbridge Ct, Matteson, IL 60443 and is currently estimated at $269,387, approximately $172 per square foot. 21350 Knightbridge Ct is a home located in Cook County with nearby schools including Colin Powell Middle School and Southland College Prep.
Ownership History
Date
Name
Owned For
Owner Type
Purchase Details
Closed on
Feb 3, 2016
Sold by
Wells Fargo Bank Na
Bought by
Fulcher Sylvester Terrell and Fulcher Susan Elaine
Current Estimated Value
Home Financials for this Owner
Home Financials are based on the most recent Mortgage that was taken out on this home.
Original Mortgage
$1,885,000
Interest Rate
3.65%
Mortgage Type
Purchase Money Mortgage
Purchase Details
Closed on
Nov 23, 2015
Sold by
Williams Cynthia
Bought by
Wells Fargo Bank Na
Purchase Details
Closed on
Jun 30, 2006
Sold by
Southwick Courtyards Ii Llc
Bought by
Williams Terry Lee
Home Financials for this Owner
Home Financials are based on the most recent Mortgage that was taken out on this home.
Original Mortgage
$242,372
Interest Rate
6.72%
Mortgage Type
Unknown
Create a Home Valuation Report for This Property
The Home Valuation Report is an in-depth analysis detailing your home's value as well as a comparison with similar homes in the area
Home Values in the Area
Average Home Value in this Area
Purchase History
| Date | Buyer | Sale Price | Title Company |
|---|---|---|---|
| Fulcher Sylvester Terrell | $79,000 | Attorneys Title Guaranty Fu | |
| Wells Fargo Bank Na | -- | Attorney | |
| Williams Terry Lee | $242,500 | Git |
Source: Public Records
Mortgage History
| Date | Status | Borrower | Loan Amount |
|---|---|---|---|
| Previous Owner | Fulcher Sylvester Terrell | $1,885,000 | |
| Previous Owner | Williams Terry Lee | $242,372 |
Source: Public Records
Tax History Compared to Growth
Tax History
| Year | Tax Paid | Tax Assessment Tax Assessment Total Assessment is a certain percentage of the fair market value that is determined by local assessors to be the total taxable value of land and additions on the property. | Land | Improvement |
|---|---|---|---|---|
| 2024 | $7,876 | $19,000 | $3,476 | $15,524 |
| 2023 | $5,825 | $19,000 | $3,476 | $15,524 |
| 2022 | $5,825 | $14,301 | $2,999 | $11,302 |
| 2021 | $5,928 | $14,300 | $2,998 | $11,302 |
| 2020 | $5,848 | $14,300 | $2,998 | $11,302 |
| 2019 | $5,488 | $13,474 | $2,726 | $10,748 |
| 2018 | $5,405 | $13,474 | $2,726 | $10,748 |
| 2017 | $5,287 | $13,474 | $2,726 | $10,748 |
| 2016 | $6,679 | $12,907 | $2,453 | $10,454 |
| 2015 | $6,558 | $12,907 | $2,453 | $10,454 |
| 2014 | $6,380 | $12,907 | $2,453 | $10,454 |
| 2013 | $6,282 | $18,163 | $2,453 | $15,710 |
Source: Public Records
Map
Nearby Homes
- 5228 Southwick Ct Unit 2
- 111 Echelon Cir
- 5503 Georgetown Dr
- 856 Notre Dame Dr
- 953 Dartmouth Ave
- 948 Dartmouth Ave
- 4613 Lindenwood Ct
- 5017 Harbor Ln
- 997 Regent Dr
- 22119 Hillside Dr
- 912 Princeton Ave
- 970 Regent Dr
- 858 Academy Ave
- 22140 Schaaf Ct
- 829 Princeton Ave
- 5631 Colgate Ln
- 5345 Stanford Ln
- 820 School Ave
- 4700 Salem Ct
- 931 Destiny Dr
- 21346 Knightbridge Ct
- 21338 Knightbridge Ct Unit 3
- 21342 Knightbridge Ct
- 5253 Mayfair Ln
- 5245 Mayfair Ln
- 5241 Mayfair Ln
- 5249 Mayfair Ln
- 5233 Mayfair Ln
- 21330 Knightbridge Ct
- 21345 Knightbridge Ct
- 21337 Knightbridge Ct
- 21341 Knightbridge Ct
- 21326 Knightbridge Ct
- 21326 Knightbridge Ct Unit 3
- 5229 Mayfair Ln
- 5225 Mayfair Ln
- 21333 Knightbridge Ct Unit 3
- 21322 Knightbridge Ct
- 21318 Knightbridge Ct
- 5220 Mayfair Ln