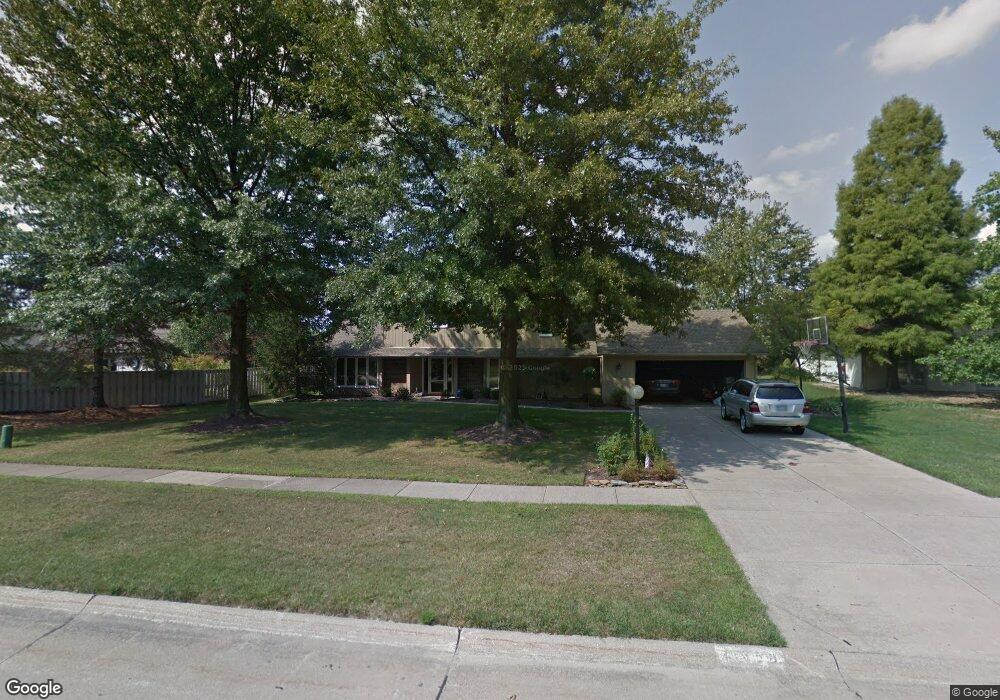
21358 Meadows Edge Ln Strongsville, OH 44149
Estimated Value: $395,000 - $501,000
3
Beds
3
Baths
2,564
Sq Ft
$174/Sq Ft
Est. Value
About This Home
This home is located at 21358 Meadows Edge Ln, Strongsville, OH 44149 and is currently estimated at $446,203, approximately $174 per square foot. 21358 Meadows Edge Ln is a home located in Cuyahoga County with nearby schools including Strongsville High School and Sts Joseph & John Interparochial School.
Ownership History
Date
Name
Owned For
Owner Type
Purchase Details
Closed on
Jun 27, 2005
Sold by
Knapp James E and Knapp Barbara A
Bought by
Moledor Bryan N and Moledor Lori M
Current Estimated Value
Home Financials for this Owner
Home Financials are based on the most recent Mortgage that was taken out on this home.
Original Mortgage
$204,800
Outstanding Balance
$108,286
Interest Rate
5.86%
Mortgage Type
Fannie Mae Freddie Mac
Estimated Equity
$337,917
Purchase Details
Closed on
Mar 31, 2000
Sold by
Navy David W and Navy Susan L
Bought by
Knapp James E and Knapp Barbara A
Home Financials for this Owner
Home Financials are based on the most recent Mortgage that was taken out on this home.
Original Mortgage
$189,389
Interest Rate
7.75%
Purchase Details
Closed on
Feb 26, 1988
Bought by
Navy David W
Purchase Details
Closed on
Jan 1, 1987
Bought by
Bob Schmitt Homes Inc
Create a Home Valuation Report for This Property
The Home Valuation Report is an in-depth analysis detailing your home's value as well as a comparison with similar homes in the area
Home Values in the Area
Average Home Value in this Area
Purchase History
| Date | Buyer | Sale Price | Title Company |
|---|---|---|---|
| Moledor Bryan N | $256,000 | Realliving | |
| Knapp James E | $205,000 | Real Estate Title | |
| Navy David W | $140,100 | -- | |
| Bob Schmitt Homes Inc | -- | -- |
Source: Public Records
Mortgage History
| Date | Status | Borrower | Loan Amount |
|---|---|---|---|
| Open | Moledor Bryan N | $204,800 | |
| Closed | Knapp James E | $189,389 | |
| Closed | Moledor Bryan N | $51,200 |
Source: Public Records
Tax History Compared to Growth
Tax History
| Year | Tax Paid | Tax Assessment Tax Assessment Total Assessment is a certain percentage of the fair market value that is determined by local assessors to be the total taxable value of land and additions on the property. | Land | Improvement |
|---|---|---|---|---|
| 2024 | $6,121 | $130,375 | $23,205 | $107,170 |
| 2023 | $6,593 | $105,290 | $25,660 | $79,630 |
| 2022 | $6,545 | $105,280 | $25,655 | $79,625 |
| 2021 | $6,493 | $105,280 | $25,660 | $79,630 |
| 2020 | $6,017 | $86,310 | $21,040 | $65,280 |
| 2019 | $5,841 | $246,600 | $60,100 | $186,500 |
| 2018 | $5,200 | $86,310 | $21,040 | $65,280 |
| 2017 | $5,194 | $78,300 | $16,700 | $61,600 |
| 2016 | $5,152 | $78,300 | $16,700 | $61,600 |
| 2015 | $5,073 | $78,300 | $16,700 | $61,600 |
| 2014 | $5,073 | $76,030 | $16,210 | $59,820 |
Source: Public Records
Map
Nearby Homes
- 21359 Briar Bush Ln
- 21469 Woodview Cir
- 10839 Prospect Rd
- 21176 Hickory Branch Trail
- 10353 Oak Branch Trail
- 20684 Albion Rd
- 11030 Southwind Ct
- 21292 Creekside Dr
- 10842 Fence Row Dr
- 0 Priem Rd
- 12579 Woodberry Ln
- 22235 North Trail
- 10824 Watercress Rd
- 22300 Rock Creek Cir
- 20424 Scotch Pine Way
- 12515 Countryside Dr
- 10830 Gate Post Rd
- 9829 Plum Brook Ln
- 12651 Alameda Dr
- 20050 Idlewood Trail
- 21324 Meadows Edge Ln
- 11487 Shagbark Trail
- 11439 Shagbark Trail
- 21373 Briar Bush Ln
- 11391 Shagbark Trail
- 21321 Briar Bush Ln
- 11553 Shagbark Trail
- 21302 Meadows Edge Ln
- 21361 Meadows Edge Ln
- 11343 Shagbark Trail
- 21396 Meadows Edge Ln
- 21333 Meadows Edge Ln
- 11605 Shagbark Trail
- 21307 Briar Bush Ln
- 11548 Shagbark Trail
- 21424 Meadows Edge Ln
- 21415 Briar Bush Ln
- 21346 Briar Bush Ln
- 21364 Briar Bush Ln
- 21328 Briar Bush Ln