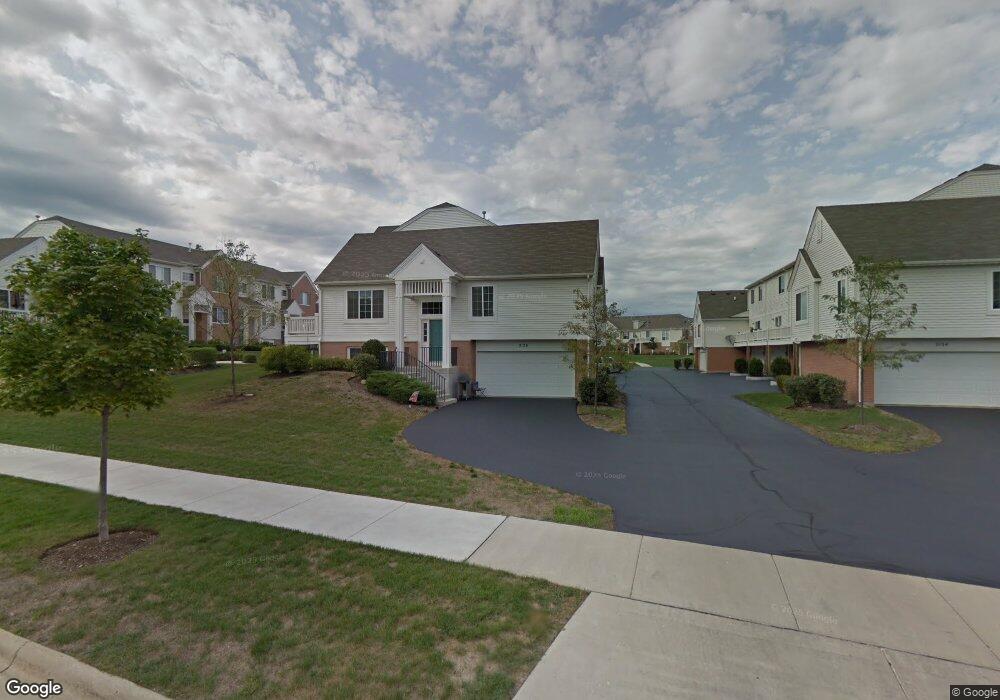
2136 Concord Dr Unit 3 McHenry, IL 60050
Estimated Value: $243,428 - $263,000
3
Beds
5
Baths
1,484
Sq Ft
$170/Sq Ft
Est. Value
About This Home
This home is located at 2136 Concord Dr Unit 3, McHenry, IL 60050 and is currently estimated at $252,357, approximately $170 per square foot. 2136 Concord Dr Unit 3 is a home located in McHenry County with nearby schools including Edgebrook Elementary School, Chauncey H Duker School, and Mchenry Middle School.
Ownership History
Date
Name
Owned For
Owner Type
Purchase Details
Closed on
Aug 15, 2020
Sold by
Moore Kathleen M
Bought by
Moore Kathleen M and Moore Christopher P
Current Estimated Value
Purchase Details
Closed on
Nov 1, 2011
Sold by
Moore Kathleen M and Moore Christopher
Bought by
Moore Kathleen M
Purchase Details
Closed on
Feb 1, 2009
Sold by
Centex Homes
Bought by
Wanshek Kathleen M
Home Financials for this Owner
Home Financials are based on the most recent Mortgage that was taken out on this home.
Original Mortgage
$163,021
Interest Rate
5.09%
Mortgage Type
VA
Create a Home Valuation Report for This Property
The Home Valuation Report is an in-depth analysis detailing your home's value as well as a comparison with similar homes in the area
Home Values in the Area
Average Home Value in this Area
Purchase History
| Date | Buyer | Sale Price | Title Company |
|---|---|---|---|
| Moore Kathleen M | -- | None Available | |
| Moore Kathleen M | -- | National Title Mortgage | |
| Wanshek Kathleen M | $159,590 | Chicago Title |
Source: Public Records
Mortgage History
| Date | Status | Borrower | Loan Amount |
|---|---|---|---|
| Previous Owner | Wanshek Kathleen M | $163,021 |
Source: Public Records
Tax History
| Year | Tax Paid | Tax Assessment Tax Assessment Total Assessment is a certain percentage of the fair market value that is determined by local assessors to be the total taxable value of land and additions on the property. | Land | Improvement |
|---|---|---|---|---|
| 2024 | $4,922 | $66,473 | $7,092 | $59,381 |
| 2023 | $4,751 | $59,612 | $6,360 | $53,252 |
| 2022 | $4,532 | $53,813 | $5,816 | $47,997 |
| 2021 | $4,344 | $50,453 | $5,453 | $45,000 |
| 2020 | $4,299 | $48,941 | $5,290 | $43,651 |
| 2019 | $4,177 | $46,530 | $5,029 | $41,501 |
| 2018 | $4,315 | $43,707 | $4,724 | $38,983 |
| 2017 | $4,231 | $41,873 | $4,526 | $37,347 |
| 2016 | $4,155 | $39,951 | $4,318 | $35,633 |
| 2013 | -- | $34,831 | $4,109 | $30,722 |
Source: Public Records
Map
Nearby Homes
- 2003 Concord Dr Unit 2003
- 4325 Savoy Ln
- 0000 Veterans Pkwy
- 2002 S Illinois Route 31
- 1510 S Illinois Route 31
- 1100 S Illinois Route 31
- 3709 Doherty Ln
- 4302 W Shamrock Ln Unit 2G
- 4314 W Shamrock Ln Unit 2D
- 2623 Cobblestone Dr
- Lot 48-53 Ridgeview Dr
- 2646 Cobblestone Dr
- 702 S Il Route 31
- 5293 Pebble Ln
- 5205 Granite Ct
- 3601 Ellen Rd
- 0 S Broadway St
- 418 Kresswood Dr Unit 2
- 613 S Broadway St
- 5198 Bull Valley Rd
- 2132 Concord Dr Unit 5
- 2134 Concord Dr Unit 4
- 2138 Concord Dr Unit 2
- 2140 Concord Dr Unit 1
- 2130 Concord Dr Unit 6
- 2116 Concord Dr Unit 6
- 2118 Concord Dr Unit 5
- 2120 Concord Dr Unit 4
- 2126 Concord Dr Unit 1
- 2122 Concord Dr
- 2118 Concord Dr Unit 21-5
- 2124 Concord Dr Unit 2
- 2124 Concord Dr Unit 2124
- 2144 Concord Dr Unit 196
- 2146 Concord Dr Unit 195
- 2148 Concord Dr Unit 194
- 2150 Concord Dr Unit 193
- 2152 Concord Dr Unit 192
- 2154 Concord Dr Unit 191
- 2146 Concord Dr Unit 192