Estimated Value: $328,132 - $370,000
3
Beds
2
Baths
1,568
Sq Ft
$222/Sq Ft
Est. Value
About This Home
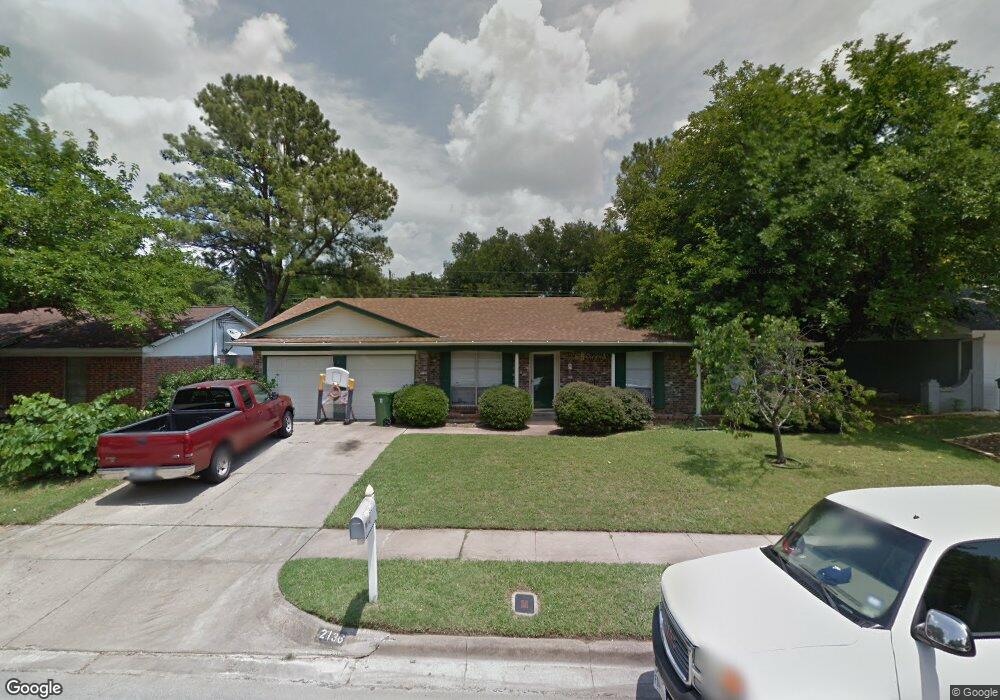
This home is located at 2136 Mountainview Dr, Hurst, TX 76054 and is currently estimated at $348,533, approximately $222 per square foot. 2136 Mountainview Dr is a home located in Tarrant County with nearby schools including Walker Creek Elementary School, Smithfield Middle School, and Birdville High School.
Ownership History
Date
Name
Owned For
Owner Type
Purchase Details
Closed on
Nov 27, 2019
Sold by
Williams Capital Investment Group Inc
Bought by
Garrett Reece Rebecca and Mcgaughy Donald Delane
Current Estimated Value
Home Financials for this Owner
Home Financials are based on the most recent Mortgage that was taken out on this home.
Original Mortgage
$245,471
Outstanding Balance
$217,051
Interest Rate
3.75%
Mortgage Type
FHA
Estimated Equity
$131,482
Purchase Details
Closed on
Jul 19, 2019
Sold by
Childress Christopher and Childress Malynda
Bought by
Williams Capital Investment Group Inc
Purchase Details
Closed on
Mar 28, 2007
Sold by
Mansfield Bruce L and Mansfield Laurie A
Bought by
Childress Christopher
Home Financials for this Owner
Home Financials are based on the most recent Mortgage that was taken out on this home.
Original Mortgage
$127,000
Interest Rate
6.24%
Mortgage Type
Purchase Money Mortgage
Create a Home Valuation Report for This Property
The Home Valuation Report is an in-depth analysis detailing your home's value as well as a comparison with similar homes in the area
Home Values in the Area
Average Home Value in this Area
Purchase History
| Date | Buyer | Sale Price | Title Company |
|---|---|---|---|
| Garrett Reece Rebecca | -- | Capital Title | |
| Williams Capital Investment Group Inc | -- | Alamo Title Company | |
| Childress Christopher | -- | Equity Title Of Tex |
Source: Public Records
Mortgage History
| Date | Status | Borrower | Loan Amount |
|---|---|---|---|
| Open | Garrett Reece Rebecca | $245,471 | |
| Previous Owner | Childress Christopher | $127,000 |
Source: Public Records
Tax History
| Year | Tax Paid | Tax Assessment Tax Assessment Total Assessment is a certain percentage of the fair market value that is determined by local assessors to be the total taxable value of land and additions on the property. | Land | Improvement |
|---|---|---|---|---|
| 2025 | $5,293 | $232,958 | $75,000 | $157,958 |
| 2024 | $5,293 | $232,958 | $75,000 | $157,958 |
| 2023 | $5,196 | $227,361 | $55,000 | $172,361 |
| 2022 | $5,082 | $205,552 | $55,000 | $150,552 |
| 2021 | $4,882 | $188,203 | $55,000 | $133,203 |
| 2020 | $5,305 | $206,433 | $55,000 | $151,433 |
| 2019 | $5,643 | $214,682 | $55,000 | $159,682 |
| 2018 | $5,160 | $196,301 | $55,000 | $141,301 |
| 2017 | $4,284 | $160,541 | $18,000 | $142,541 |
| 2016 | $4,013 | $150,402 | $18,000 | $132,402 |
| 2015 | $3,254 | $121,300 | $17,000 | $104,300 |
| 2014 | $3,254 | $121,300 | $17,000 | $104,300 |
Source: Public Records
Map
Nearby Homes
- 2204 Mountainview Dr
- 421 Cavender Ct
- 317 Northglen Dr
- 2157 Lookout Ct
- 2221 Farrington Ln
- 404 Mountainview Dr
- 2244 Hurstview Dr
- 227 Norwich Dr
- 1913 Yucca Trail
- 1905 Cimarron Trail
- 200 Eagle Ct
- 440 W Louella Dr
- 2620 Brookridge Dr
- 600 Circleview Dr N
- 2701 Hurstview Dr
- 305 Warbler Dr
- 3006 Carolyn Ct
- 201 W Louella Dr
- 612 Circleview Dr S
- 413 Blue Jay Ct
- 2140 Mountainview Dr
- 2132 Mountainview Dr
- 2137 Cambridge Dr
- 2141 Cambridge Dr
- 2133 Cambridge Dr
- 2128 Mountainview Dr
- 2144 Mountainview Dr
- 2137 Mountainview Dr
- 2133 Mountainview Dr
- 2141 Mountainview Dr
- 2145 Cambridge Dr
- 2129 Cambridge Dr
- 2129 Mountainview Dr
- 2124 Mountainview Dr
- 2148 Mountainview Dr
- 2145 Mountainview Dr
- 2149 Cambridge Dr
- 2125 Cambridge Dr
- 421 Salem Dr
- 2125 Mountainview Dr
Your Personal Tour Guide
Ask me questions while you tour the home.