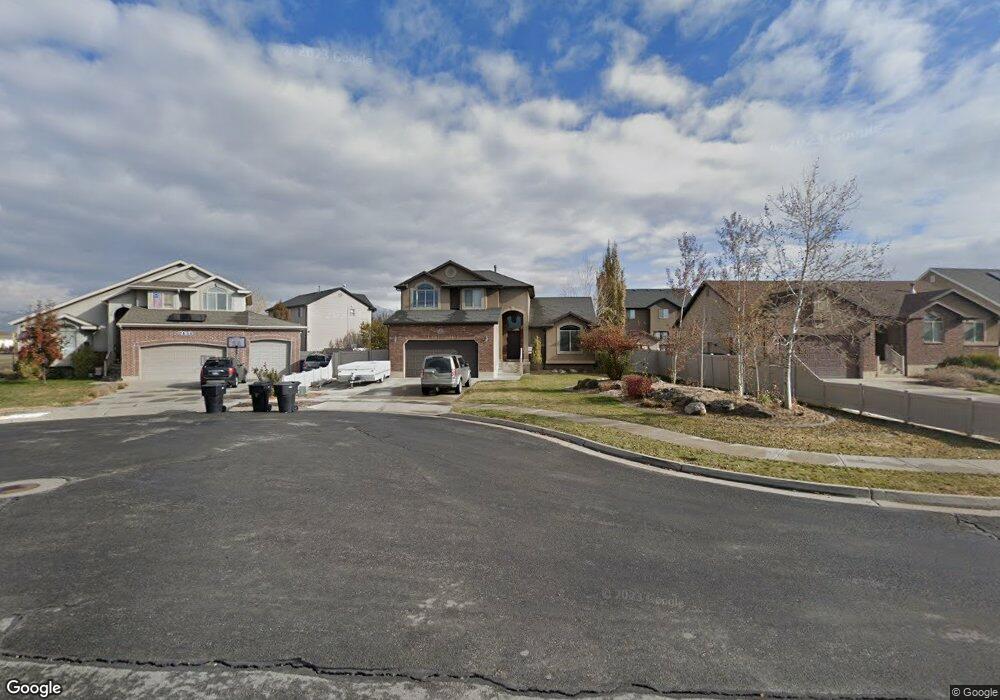
2136 N 1450 W Clearfield, UT 84015
Estimated Value: $524,000 - $593,000
3
Beds
3
Baths
3,068
Sq Ft
$183/Sq Ft
Est. Value
About This Home
This home is located at 2136 N 1450 W, Clearfield, UT 84015 and is currently estimated at $561,528, approximately $183 per square foot. 2136 N 1450 W is a home located in Davis County with nearby schools including Parkside Elementary School, Sunset Junior High School, and Clearfield High School.
Ownership History
Date
Name
Owned For
Owner Type
Purchase Details
Closed on
Feb 11, 2019
Sold by
Messer Johntana
Bought by
Messer Shauntel
Current Estimated Value
Home Financials for this Owner
Home Financials are based on the most recent Mortgage that was taken out on this home.
Original Mortgage
$318,000
Outstanding Balance
$279,016
Interest Rate
4.5%
Mortgage Type
New Conventional
Estimated Equity
$282,512
Purchase Details
Closed on
Mar 26, 2008
Sold by
Shulz Construction Inc
Bought by
Hill Jeffery K and Hill Valen
Home Financials for this Owner
Home Financials are based on the most recent Mortgage that was taken out on this home.
Original Mortgage
$206,456
Interest Rate
5.72%
Mortgage Type
Purchase Money Mortgage
Purchase Details
Closed on
Jul 28, 2006
Sold by
Shron Inc
Bought by
Shulz Construction
Create a Home Valuation Report for This Property
The Home Valuation Report is an in-depth analysis detailing your home's value as well as a comparison with similar homes in the area
Home Values in the Area
Average Home Value in this Area
Purchase History
| Date | Buyer | Sale Price | Title Company |
|---|---|---|---|
| Messer Shauntel | -- | Us Title Company | |
| Hill Jeffery K | -- | Heritage West Title Ins Agen | |
| Shulz Construction | -- | Home Abst & Title Co |
Source: Public Records
Mortgage History
| Date | Status | Borrower | Loan Amount |
|---|---|---|---|
| Open | Messer Shauntel | $318,000 | |
| Closed | Hill Jeffery K | $206,456 |
Source: Public Records
Tax History Compared to Growth
Tax History
| Year | Tax Paid | Tax Assessment Tax Assessment Total Assessment is a certain percentage of the fair market value that is determined by local assessors to be the total taxable value of land and additions on the property. | Land | Improvement |
|---|---|---|---|---|
| 2025 | $2,974 | $286,000 | $93,212 | $192,788 |
| 2024 | $2,868 | $277,200 | $102,629 | $174,571 |
| 2023 | $2,712 | $485,000 | $116,469 | $368,531 |
| 2022 | $2,852 | $282,150 | $71,611 | $210,539 |
| 2021 | $2,541 | $373,000 | $89,028 | $283,972 |
| 2020 | $2,210 | $321,000 | $75,322 | $245,678 |
| 2019 | $2,142 | $304,000 | $88,626 | $215,374 |
| 2018 | $0 | $277,000 | $74,936 | $202,064 |
| 2016 | $192 | $140,470 | $29,112 | $111,358 |
| 2015 | $1,814 | $124,190 | $29,112 | $95,078 |
| 2014 | $1,609 | $111,856 | $29,112 | $82,744 |
| 2013 | -- | $117,276 | $27,143 | $90,133 |
Source: Public Records
Map
Nearby Homes