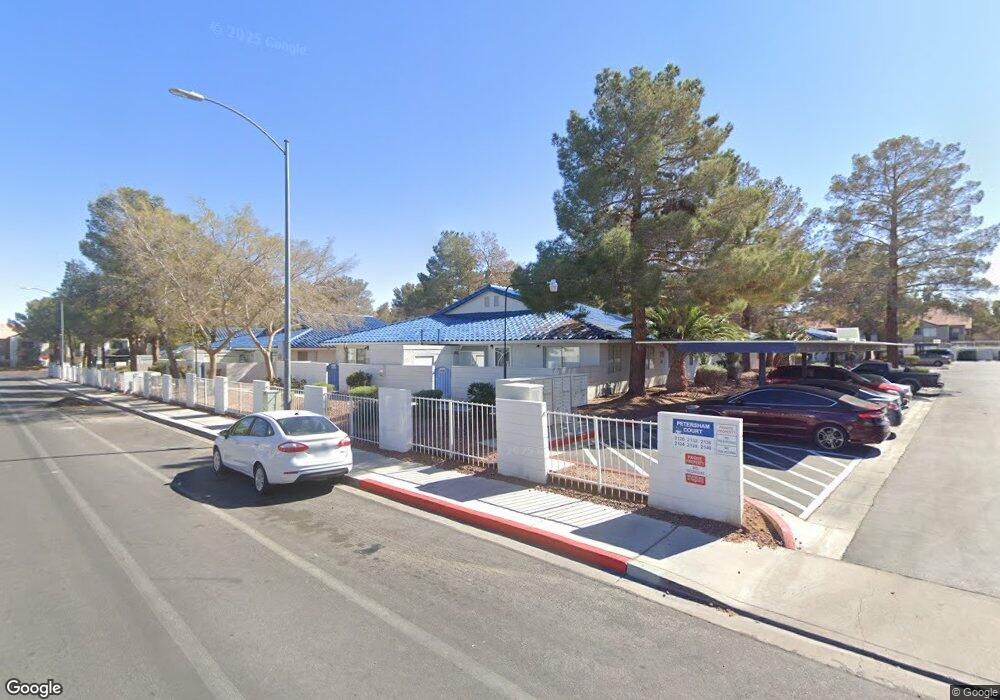
2136 Petersham Ct Unit D Las Vegas, NV 89108
Michael Way NeighborhoodEstimated Value: $198,452 - $217,000
2
Beds
2
Baths
728
Sq Ft
$290/Sq Ft
Est. Value
About This Home
This home is located at 2136 Petersham Ct Unit D, Las Vegas, NV 89108 and is currently estimated at $211,363, approximately $290 per square foot. 2136 Petersham Ct Unit D is a home located in Clark County with nearby schools including Lilly & Wing Fong Elementary School, J. Harold Brinley Middle School, and Cimarron Memorial High School.
Ownership History
Date
Name
Owned For
Owner Type
Purchase Details
Closed on
May 22, 2015
Sold by
Rifmaiden Antonie
Bought by
Banks Cathryn
Current Estimated Value
Purchase Details
Closed on
Jul 9, 2009
Sold by
Indymac Federal Bank Fsb
Bought by
Rigmaiden Antoine
Purchase Details
Closed on
Apr 29, 2009
Sold by
Meza Ruiz Percy B
Bought by
Indymac Federal Bank Fsb
Purchase Details
Closed on
Mar 29, 2005
Sold by
Espino Lucinda Diaz
Bought by
Meza Ruiz Percy B
Home Financials for this Owner
Home Financials are based on the most recent Mortgage that was taken out on this home.
Original Mortgage
$125,000
Interest Rate
6.75%
Mortgage Type
New Conventional
Purchase Details
Closed on
Mar 24, 2005
Sold by
Francis Louis A
Bought by
Meza Ruiz Percy B
Home Financials for this Owner
Home Financials are based on the most recent Mortgage that was taken out on this home.
Original Mortgage
$125,000
Interest Rate
6.75%
Mortgage Type
New Conventional
Create a Home Valuation Report for This Property
The Home Valuation Report is an in-depth analysis detailing your home's value as well as a comparison with similar homes in the area
Home Values in the Area
Average Home Value in this Area
Purchase History
| Date | Buyer | Sale Price | Title Company |
|---|---|---|---|
| Banks Cathryn | -- | None Available | |
| Rigmaiden Antoine | $48,000 | Noble Title | |
| Indymac Federal Bank Fsb | $41,600 | Fidelity National Default So | |
| Meza Ruiz Percy B | -- | Nevada Title Company | |
| Meza Ruiz Percy B | $125,000 | Nevada Title Company |
Source: Public Records
Mortgage History
| Date | Status | Borrower | Loan Amount |
|---|---|---|---|
| Previous Owner | Meza Ruiz Percy B | $125,000 |
Source: Public Records
Tax History Compared to Growth
Tax History
| Year | Tax Paid | Tax Assessment Tax Assessment Total Assessment is a certain percentage of the fair market value that is determined by local assessors to be the total taxable value of land and additions on the property. | Land | Improvement |
|---|---|---|---|---|
| 2025 | $501 | $34,624 | $15,295 | $19,329 |
| 2024 | $487 | $34,624 | $15,295 | $19,329 |
| 2023 | $487 | $37,795 | $19,618 | $18,177 |
| 2022 | $473 | $33,681 | $16,293 | $17,388 |
| 2021 | $459 | $29,105 | $14,298 | $14,807 |
| 2020 | $443 | $29,538 | $13,965 | $15,573 |
| 2019 | $430 | $27,312 | $11,970 | $15,342 |
| 2018 | $418 | $20,171 | $5,320 | $14,851 |
| 2017 | $656 | $19,999 | $5,040 | $14,959 |
| 2016 | $397 | $18,996 | $4,410 | $14,586 |
| 2015 | $395 | $15,537 | $3,150 | $12,387 |
| 2014 | $382 | $11,685 | $3,150 | $8,535 |
Source: Public Records
Map
Nearby Homes
- 2120 Chertsey Dr Unit D
- 2120 Chertsey Dr Unit C
- 2141 Twickenham Place Unit D
- 2128 Chertsey Dr Unit C
- 2132 Chertsey Dr Unit B
- 2132 Chertsey Dr Unit D
- 6457 Blue Blossom Ave
- 2121 Chertsey Dr Unit D
- 2140 Willowbury Dr Unit A
- 2120 Willowbury Dr Unit C
- 2204 Short Pine Dr
- 2108 Willowbury Dr Unit B
- 2112 Willowbury Dr Unit B
- 6324 Eugene Ave
- 2140 Bavington Dr Unit B
- 2128 Bavington Dr Unit A
- 2248 Short Pine Dr
- 2116 Bavington Dr Unit C
- 2136 Bavington Dr Unit A
- 2132 Bavington Dr Unit D
- 2136 Petersham Ct
- 2136 Petersham Ct Unit A
- 2136 Petersham Ct Unit C
- 2136 Petersham Ct Unit B
- 2140 Petersham Ct Unit A
- 2140 Petersham Ct Unit D
- 2140 Petersham Ct Unit B
- 2132 Petersham Ct
- 2132 Petersham Ct Unit C
- 2132 Petersham Ct Unit A
- 2132 Petersham Ct Unit B
- 2128 Petersham Ct Unit D
- 2128 Petersham Ct Unit B
- 2128 Petersham Ct Unit C
- 2128 Petersham Ct Unit A
- 2120 Chertsey Dr Unit A
- 2120 Chertsey Dr Unit B
- 2137 Petersham Ct Unit A