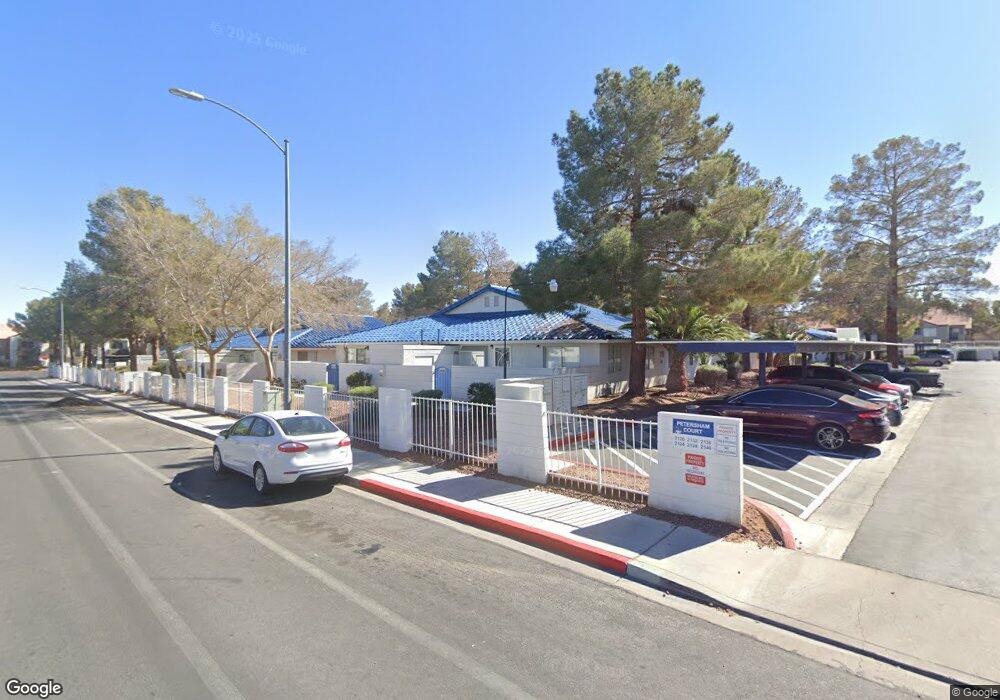
2136 Petersham Ct Las Vegas, NV 89108
Michael Way NeighborhoodEstimated Value: $215,999
2
Beds
2
Baths
728
Sq Ft
$297/Sq Ft
Est. Value
About This Home
This home is located at 2136 Petersham Ct, Las Vegas, NV 89108 and is currently priced at $215,999, approximately $296 per square foot. 2136 Petersham Ct is a home located in Clark County with nearby schools including Lilly & Wing Fong Elementary School, J. Harold Brinley Middle School, and Cimarron Memorial High School.
Ownership History
Date
Name
Owned For
Owner Type
Purchase Details
Closed on
Jan 29, 2021
Sold by
Espinoza Julie M
Bought by
Tahbaz Behzad
Current Estimated Value
Purchase Details
Closed on
Dec 19, 2019
Sold by
Anderson Joshua and Anderson Theresa
Bought by
Espinoza Julie M
Purchase Details
Closed on
Jul 8, 2013
Sold by
Johns Cassandra A
Bought by
Anderson Joshua and Anderson Theresa
Purchase Details
Closed on
Jul 17, 2007
Sold by
Daubert Gregory
Bought by
Johns Cassandra A
Home Financials for this Owner
Home Financials are based on the most recent Mortgage that was taken out on this home.
Original Mortgage
$152,000
Interest Rate
6.51%
Mortgage Type
Unknown
Purchase Details
Closed on
Jul 22, 2002
Sold by
Mcatamney David P and Mcatamney Lenora R
Bought by
Daubert Gregory
Home Financials for this Owner
Home Financials are based on the most recent Mortgage that was taken out on this home.
Original Mortgage
$76,145
Interest Rate
6.7%
Mortgage Type
FHA
Create a Home Valuation Report for This Property
The Home Valuation Report is an in-depth analysis detailing your home's value as well as a comparison with similar homes in the area
Home Values in the Area
Average Home Value in this Area
Purchase History
| Date | Buyer | Sale Price | Title Company |
|---|---|---|---|
| Tahbaz Behzad | $160,000 | Roc Title | |
| Espinoza Julie M | -- | Roc Title | |
| Espinoza Julie M | $125,000 | Ticor Title Henderson | |
| Anderson Joshua | $58,000 | Lawyers Title Of Nevada Cha | |
| Johns Cassandra A | $160,000 | Lawyers Title Of Nevada | |
| Daubert Gregory | $78,500 | First American Title Co |
Source: Public Records
Mortgage History
| Date | Status | Borrower | Loan Amount |
|---|---|---|---|
| Previous Owner | Johns Cassandra A | $152,000 | |
| Previous Owner | Daubert Gregory | $76,145 |
Source: Public Records
Tax History Compared to Growth
Tax History
| Year | Tax Paid | Tax Assessment Tax Assessment Total Assessment is a certain percentage of the fair market value that is determined by local assessors to be the total taxable value of land and additions on the property. | Land | Improvement |
|---|---|---|---|---|
| 2025 | $636 | $34,624 | $15,295 | $19,329 |
| 2024 | $590 | $34,624 | $15,295 | $19,329 |
| 2023 | $590 | $37,795 | $19,618 | $18,177 |
| 2022 | $546 | $33,681 | $16,293 | $17,388 |
| 2021 | $506 | $29,105 | $14,298 | $14,807 |
| 2020 | $467 | $29,538 | $13,965 | $15,573 |
| 2019 | $438 | $27,312 | $11,970 | $15,342 |
| 2018 | $418 | $20,171 | $5,320 | $14,851 |
| 2017 | $656 | $19,999 | $5,040 | $14,959 |
| 2016 | $392 | $19,641 | $4,410 | $15,231 |
| 2015 | $390 | $16,093 | $3,150 | $12,943 |
| 2014 | $378 | $11,685 | $3,150 | $8,535 |
Source: Public Records
Map
Nearby Homes
- 2120 Chertsey Dr Unit D
- 2120 Chertsey Dr Unit C
- 2141 Twickenham Place Unit D
- 2128 Chertsey Dr Unit C
- 2132 Chertsey Dr Unit B
- 2132 Chertsey Dr Unit D
- 6457 Blue Blossom Ave
- 2121 Chertsey Dr Unit D
- 2140 Willowbury Dr Unit A
- 2120 Willowbury Dr Unit C
- 2204 Short Pine Dr
- 2108 Willowbury Dr Unit B
- 2112 Willowbury Dr Unit B
- 6324 Eugene Ave
- 2140 Bavington Dr Unit B
- 2128 Bavington Dr Unit A
- 2248 Short Pine Dr
- 2116 Bavington Dr Unit C
- 2136 Bavington Dr Unit A
- 2132 Bavington Dr Unit D
- 2136 Petersham Ct Unit D
- 2136 Petersham Ct Unit A
- 2136 Petersham Ct Unit C
- 2136 Petersham Ct Unit B
- 2140 Petersham Ct Unit A
- 2140 Petersham Ct Unit D
- 2140 Petersham Ct Unit B
- 2132 Petersham Ct
- 2132 Petersham Ct Unit C
- 2132 Petersham Ct Unit A
- 2132 Petersham Ct Unit B
- 2128 Petersham Ct Unit D
- 2128 Petersham Ct Unit B
- 2128 Petersham Ct Unit C
- 2128 Petersham Ct Unit A
- 2120 Chertsey Dr Unit A
- 2120 Chertsey Dr Unit B
- 2137 Petersham Ct Unit A