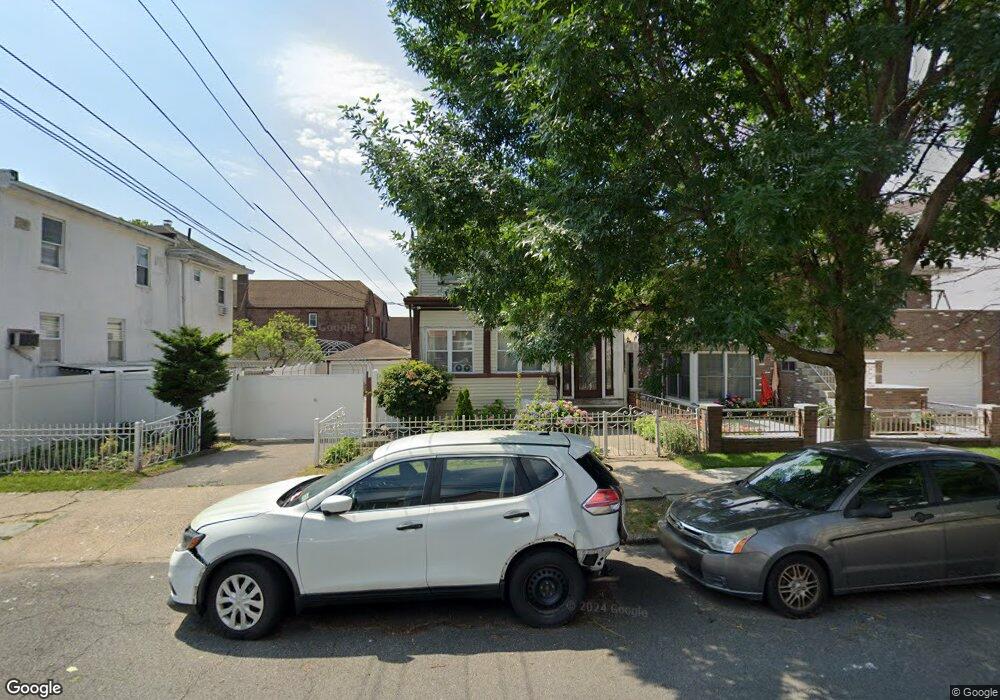
2136 Strang Ave Bronx, NY 10466
Edenwald NeighborhoodEstimated Value: $838,000 - $964,000
5
Beds
2
Baths
2,430
Sq Ft
$363/Sq Ft
Est. Value
About This Home
This home is located at 2136 Strang Ave, Bronx, NY 10466 and is currently estimated at $882,997, approximately $363 per square foot. 2136 Strang Ave is a home located in Bronx County with nearby schools including P.S. 68 - Bronx, Baychester Middle School, and One World Middle School At Edenwald.
Ownership History
Date
Name
Owned For
Owner Type
Purchase Details
Closed on
May 17, 2019
Sold by
Beverley Olga and Beverley Vincent
Bought by
James Clovis and Maxam Vivienne
Current Estimated Value
Home Financials for this Owner
Home Financials are based on the most recent Mortgage that was taken out on this home.
Original Mortgage
$603,860
Outstanding Balance
$529,837
Interest Rate
4.1%
Mortgage Type
New Conventional
Estimated Equity
$353,160
Purchase Details
Closed on
Nov 14, 1995
Sold by
Raghunanan Errol and Raghunanan Rosalind
Bought by
Beverly Vincent and Beverly Olga
Home Financials for this Owner
Home Financials are based on the most recent Mortgage that was taken out on this home.
Original Mortgage
$202,500
Interest Rate
7.33%
Mortgage Type
Purchase Money Mortgage
Purchase Details
Closed on
Sep 6, 1994
Sold by
Raghunanan Lincoln and Raghunanan Rosalind
Bought by
Raghunanan Rosalind and Raghunanan Errol
Create a Home Valuation Report for This Property
The Home Valuation Report is an in-depth analysis detailing your home's value as well as a comparison with similar homes in the area
Home Values in the Area
Average Home Value in this Area
Purchase History
| Date | Buyer | Sale Price | Title Company |
|---|---|---|---|
| James Clovis | $615,000 | -- | |
| James Clovis | $615,000 | -- | |
| Beverly Vincent | $225,000 | Commonwealth Land Title Ins | |
| Beverly Vincent | $225,000 | Commonwealth Land Title Ins | |
| Raghunanan Rosalind | -- | Commonwealth Land Title Ins | |
| Raghunanan Rosalind | -- | Commonwealth Land Title Ins |
Source: Public Records
Mortgage History
| Date | Status | Borrower | Loan Amount |
|---|---|---|---|
| Open | James Clovis | $603,860 | |
| Closed | James Clovis | $603,860 | |
| Previous Owner | Beverly Vincent | $202,500 |
Source: Public Records
Tax History
| Year | Tax Paid | Tax Assessment Tax Assessment Total Assessment is a certain percentage of the fair market value that is determined by local assessors to be the total taxable value of land and additions on the property. | Land | Improvement |
|---|---|---|---|---|
| 2025 | $7,705 | $38,362 | $8,155 | $30,207 |
| 2024 | $7,705 | $38,362 | $8,573 | $29,789 |
| 2023 | $7,539 | $37,123 | $8,265 | $28,858 |
| 2022 | $6,994 | $41,820 | $10,740 | $31,080 |
| 2021 | $7,131 | $41,580 | $10,740 | $30,840 |
| 2020 | $6,767 | $44,160 | $10,740 | $33,420 |
| 2019 | $6,687 | $45,540 | $10,740 | $34,800 |
| 2018 | $6,306 | $30,936 | $9,138 | $21,798 |
| 2017 | $5,952 | $29,196 | $9,349 | $19,847 |
| 2016 | $5,645 | $28,238 | $8,670 | $19,568 |
| 2015 | $3,102 | $26,640 | $11,940 | $14,700 |
| 2014 | $3,102 | $26,640 | $11,940 | $14,700 |
Source: Public Records
Map
Nearby Homes
- 2181 Strang Ave
- 3963 Duryea Ave
- 3968 Duryea Ave
- 3964 Duryea Ave
- 4073 Monticello Ave
- 4083 Seton Ave
- 4058 Murdock Ave
- 4016 Wilder Ave
- 3919 Murdock Ave
- 3924 Duryea Ave
- 3919 Pratt Ave
- 3940 de Reimer Ave
- 29 Bell Ave
- 4040 Pratt Ave
- 4013 de Reimer Ave
- 4118 Hill Ave
- 1461 E 233rd St
- 138 W Kingsbridge Rd
- 75 W Kingsbridge Rd
- 4048 Harper Ave
- 2136 Strang Ave Unit 2
- 3977 Seton Ave
- 2132 Strang Ave
- 3963 Seton Ave
- 3961 Seton Ave
- 3974 Monticello Ave
- 2130 Strang Ave
- 3959 Seton Ave
- 3972 Monticello Ave
- 4006 Monticello Ave
- 2150 Strang Ave
- 3957 Seton Ave
- 2139 Strang Ave
- 2141 Strang Ave
- 2152 Strang Ave
- 2131 Strang Ave
- 2143 Strang Ave
- 3960 Monticello Ave
- 2129 Strang Ave
- 3955 Seton Ave
Your Personal Tour Guide
Ask me questions while you tour the home.