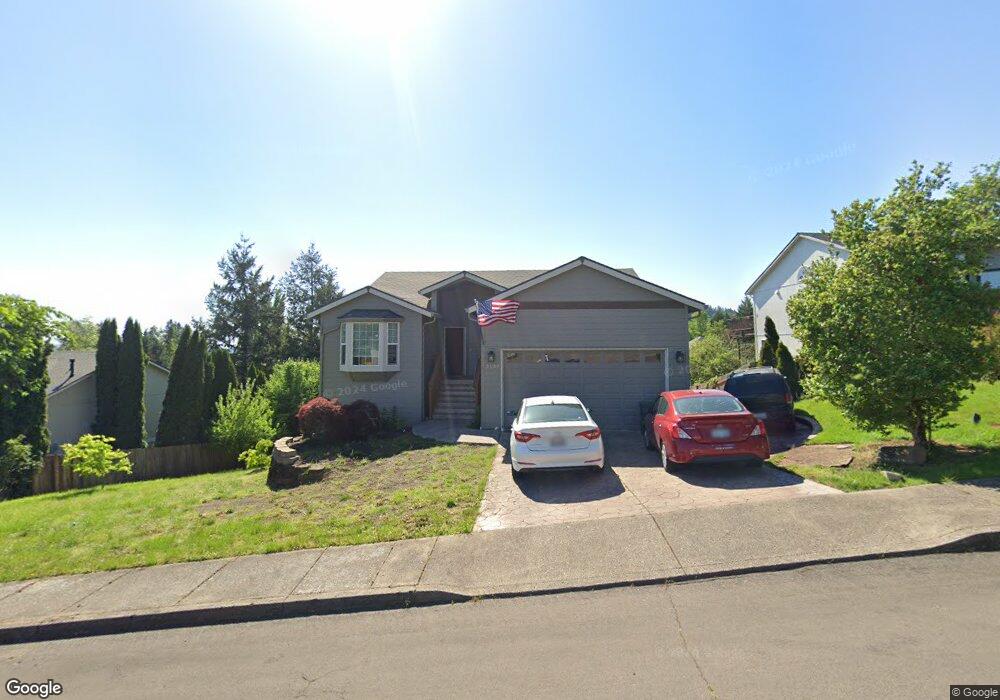
2137 38th Ct Washougal, WA 98671
Estimated Value: $622,000 - $714,000
4
Beds
3
Baths
1,553
Sq Ft
$431/Sq Ft
Est. Value
About This Home
This home is located at 2137 38th Ct, Washougal, WA 98671 and is currently estimated at $668,798, approximately $430 per square foot. 2137 38th Ct is a home located in Clark County with nearby schools including Gause Elementary School, Jemtegaard Middle School, and Washougal High School.
Ownership History
Date
Name
Owned For
Owner Type
Purchase Details
Closed on
Apr 23, 1997
Sold by
Kimball Hill Homes Washington Inc
Bought by
Fialdini Michael G and Fialdini Susie E
Current Estimated Value
Home Financials for this Owner
Home Financials are based on the most recent Mortgage that was taken out on this home.
Original Mortgage
$122,850
Outstanding Balance
$15,842
Interest Rate
7.86%
Mortgage Type
Purchase Money Mortgage
Estimated Equity
$652,956
Purchase Details
Closed on
Dec 24, 1996
Sold by
Cassidy Frank L and King Joseph E
Bought by
Kimball Hill Homes Washington Inc
Create a Home Valuation Report for This Property
The Home Valuation Report is an in-depth analysis detailing your home's value as well as a comparison with similar homes in the area
Home Values in the Area
Average Home Value in this Area
Purchase History
| Date | Buyer | Sale Price | Title Company |
|---|---|---|---|
| Fialdini Michael G | $153,602 | First American Title Ins Co | |
| Kimball Hill Homes Washington Inc | $171,252 | First American Title |
Source: Public Records
Mortgage History
| Date | Status | Borrower | Loan Amount |
|---|---|---|---|
| Open | Fialdini Michael G | $122,850 |
Source: Public Records
Tax History Compared to Growth
Tax History
| Year | Tax Paid | Tax Assessment Tax Assessment Total Assessment is a certain percentage of the fair market value that is determined by local assessors to be the total taxable value of land and additions on the property. | Land | Improvement |
|---|---|---|---|---|
| 2025 | $5,951 | $638,509 | $120,000 | $518,509 |
| 2024 | $5,737 | $627,539 | $144,000 | $483,539 |
| 2023 | $4,861 | $548,135 | $154,800 | $393,335 |
| 2022 | $4,820 | $525,199 | $154,800 | $370,399 |
| 2021 | $3,179 | $451,903 | $132,000 | $319,903 |
| 2020 | $1,346 | $279,555 | $120,000 | $159,555 |
| 2019 | $3,528 | $120,000 | $120,000 | $0 |
| 2018 | $3,783 | $333,299 | $0 | $0 |
| 2017 | $3,240 | $295,011 | $0 | $0 |
| 2016 | $3,149 | $277,453 | $0 | $0 |
| 2015 | $3,004 | $246,634 | $0 | $0 |
| 2014 | -- | $234,042 | $0 | $0 |
| 2013 | -- | $204,545 | $0 | $0 |
Source: Public Records
Map
Nearby Homes