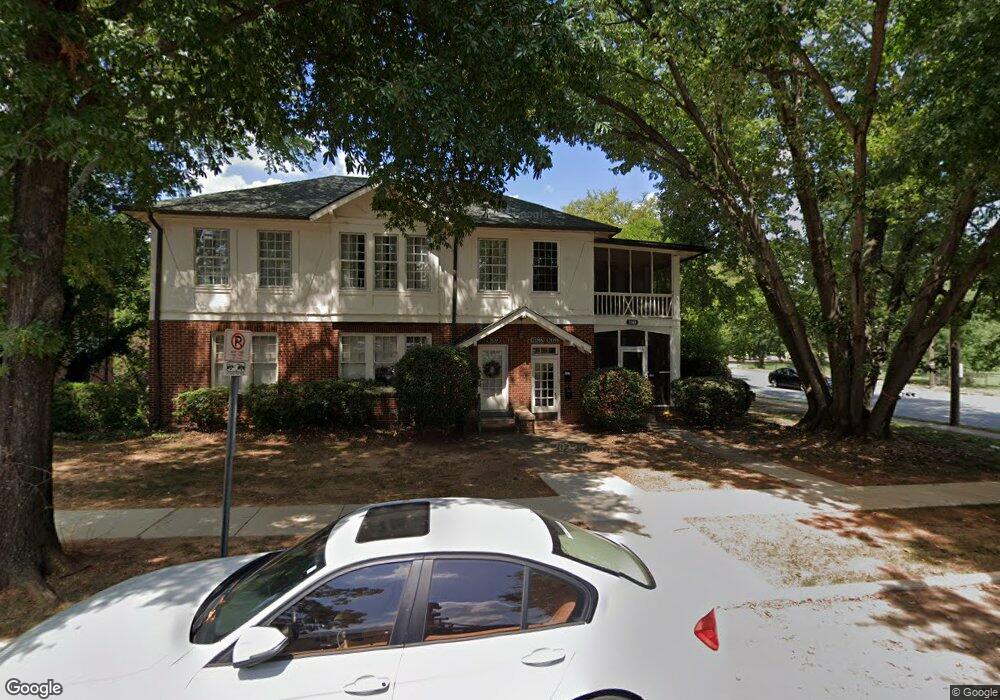
2137 Dartmouth Place Unit C1 Charlotte, NC 28207
Myers Park NeighborhoodEstimated Value: $307,000 - $475,000
2
Beds
1
Bath
1,189
Sq Ft
$312/Sq Ft
Est. Value
About This Home
This home is located at 2137 Dartmouth Place Unit C1, Charlotte, NC 28207 and is currently estimated at $370,524, approximately $311 per square foot. 2137 Dartmouth Place Unit C1 is a home located in Mecklenburg County with nearby schools including Eastover Elementary, Sedgefield Middle School, and Myers Park High.
Ownership History
Date
Name
Owned For
Owner Type
Purchase Details
Closed on
Jul 14, 2025
Sold by
Samal Sushanta K and Samal Sarojini
Bought by
Oak Tree Capital Investments Llc
Current Estimated Value
Purchase Details
Closed on
Mar 27, 2024
Sold by
Garland Janet and Caponi Janet
Bought by
Satnal Sushanta K and Samal Sarujini
Home Financials for this Owner
Home Financials are based on the most recent Mortgage that was taken out on this home.
Original Mortgage
$252,000
Interest Rate
6.94%
Mortgage Type
New Conventional
Purchase Details
Closed on
Jun 10, 2005
Sold by
Houston Sara E
Bought by
Garland Janet
Home Financials for this Owner
Home Financials are based on the most recent Mortgage that was taken out on this home.
Original Mortgage
$22,500
Interest Rate
7.12%
Mortgage Type
Stand Alone Second
Create a Home Valuation Report for This Property
The Home Valuation Report is an in-depth analysis detailing your home's value as well as a comparison with similar homes in the area
Home Values in the Area
Average Home Value in this Area
Purchase History
| Date | Buyer | Sale Price | Title Company |
|---|---|---|---|
| Oak Tree Capital Investments Llc | -- | None Listed On Document | |
| Oak Tree Capital Investments Llc | -- | None Listed On Document | |
| Satnal Sushanta K | $315,000 | None Listed On Document | |
| Satnal Sushanta K | $315,000 | None Listed On Document | |
| Garland Janet | $150,000 | -- |
Source: Public Records
Mortgage History
| Date | Status | Borrower | Loan Amount |
|---|---|---|---|
| Previous Owner | Satnal Sushanta K | $252,000 | |
| Previous Owner | Garland Janet | $22,500 |
Source: Public Records
Tax History Compared to Growth
Tax History
| Year | Tax Paid | Tax Assessment Tax Assessment Total Assessment is a certain percentage of the fair market value that is determined by local assessors to be the total taxable value of land and additions on the property. | Land | Improvement |
|---|---|---|---|---|
| 2025 | $2,359 | $291,282 | -- | $291,282 |
| 2024 | $2,359 | $291,282 | -- | $291,282 |
| 2023 | $2,359 | $291,282 | $0 | $291,282 |
| 2022 | $2,132 | $207,900 | $0 | $207,900 |
| 2021 | $2,121 | $207,900 | $0 | $207,900 |
| 2020 | $2,113 | $207,900 | $0 | $207,900 |
| 2019 | $2,098 | $207,900 | $0 | $207,900 |
| 2018 | $2,097 | $154,200 | $55,000 | $99,200 |
| 2017 | $2,059 | $154,200 | $55,000 | $99,200 |
| 2016 | $2,049 | $154,200 | $55,000 | $99,200 |
| 2015 | $2,038 | $154,200 | $55,000 | $99,200 |
| 2014 | $2,020 | $154,200 | $55,000 | $99,200 |
Source: Public Records
Map
Nearby Homes
- 201 Circle Ave
- 409 Queens Rd Unit 202
- 409 Queens Rd Unit 401
- 409 Queens Rd Unit 302
- 409 Queens Rd Unit 403
- 409 Queens Rd Unit 204
- 409 Queens Rd Unit 303
- 409 Queens Rd Unit 402
- 409 Queens Rd Unit 203
- 409 Queens Rd Unit 103
- 409 Queens Rd Unit 301
- 409 Queens Rd Unit 501
- 409 Queens Rd Unit 503
- 409 Queens Rd Unit 102
- 525 Queens Rd Unit 525
- 416 Queens Rd Unit 19
- 318 S Laurel Ave Unit B
- 224 S Laurel Ave
- 400 Queens Rd Unit D6
- 226 S Laurel Ave
- 2139 Dartmouth Place Unit C4
- 2139 Dartmouth Place Unit A
- 2143 Dartmouth Place
- 2143 Dartmouth Place Unit A
- 228 Providence Rd
- 228 Providence Rd Unit D
- 2131 Dartmouth Place Unit A
- 2131 Dartmouth Place
- 224 Providence Rd Unit D1
- 222 Providence Rd Unit D3
- 222 Providence Rd Unit n/a
- 230 Providence Rd Unit C
- 2121 Dartmouth Place
- 226 Providence Rd Unit D5
- 230 Providence Rd Unit C5
- 2141 Dartmouth Place Unit C2
- 2135 Dartmouth Place
- 2121 Dartmouth Place
- 2129 Dartmouth Place
- 2129 Dartmouth Place Unit B1