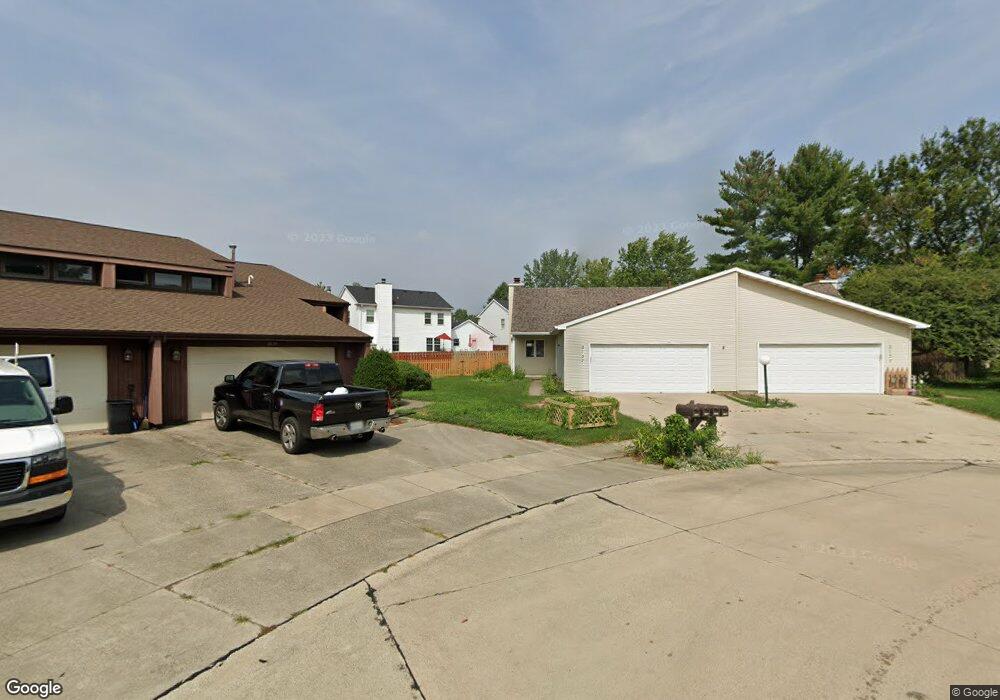
2137 Peach St Unit 1 Champaign, IL 61820
Bolten Field NeighborhoodEstimated Value: $169,000 - $222,000
Studio
--
Bath
--
Sq Ft
1,742
Sq Ft Lot Lot
About This Home
This home is located at 2137 Peach St Unit 1, Champaign, IL 61820 and is currently estimated at $193,397. 2137 Peach St Unit 1 is a home located in Champaign County with nearby schools including Central High School, Devonshire KinderCare, and Montessori Habitat School.
Ownership History
Date
Name
Owned For
Owner Type
Purchase Details
Closed on
Jul 11, 2018
Sold by
Carico Judy A
Bought by
Wadley Terry L
Current Estimated Value
Home Financials for this Owner
Home Financials are based on the most recent Mortgage that was taken out on this home.
Original Mortgage
$102,000
Outstanding Balance
$87,086
Interest Rate
4.5%
Mortgage Type
New Conventional
Estimated Equity
$106,311
Purchase Details
Closed on
Aug 7, 2013
Sold by
Carico Ted M
Bought by
Carico Judy A
Purchase Details
Closed on
Jun 29, 2012
Sold by
Mcmaster Kathleen
Bought by
Carico Ted M and Carico Judy A
Purchase Details
Closed on
Jun 26, 2003
Sold by
Rettker Thomas J
Bought by
Mcmaster Kathleen
Home Financials for this Owner
Home Financials are based on the most recent Mortgage that was taken out on this home.
Original Mortgage
$118,750
Interest Rate
5.3%
Mortgage Type
Purchase Money Mortgage
Create a Home Valuation Report for This Property
The Home Valuation Report is an in-depth analysis detailing your home's value as well as a comparison with similar homes in the area
Home Values in the Area
Average Home Value in this Area
Purchase History
We collect this data history from publicly available records. To have your information removed, we recommend requesting removal directly through your county’s website.
| Date | Buyer | Sale Price | Title Company |
|---|---|---|---|
| Wadley Terry L | $128,000 | Attorney | |
| Carico Judy A | -- | None Available | |
| Carico Ted M | $126,000 | None Available | |
| Mcmaster Kathleen | $125,000 | -- |
Source: Public Records
Mortgage History
We collect this data history from publicly available records. To have your information removed, we recommend requesting removal directly through your county’s website.
| Date | Status | Borrower | Loan Amount |
|---|---|---|---|
| Open | Wadley Terry L | $102,000 | |
| Previous Owner | Mcmaster Kathleen | $118,750 |
Source: Public Records
Tax History
| Year | Tax Paid | Tax Assessment Tax Assessment Total Assessment is a certain percentage of the fair market value that is determined by local assessors to be the total taxable value of land and additions on the property. | Land | Improvement |
|---|---|---|---|---|
| 2025 | $3,805 | $61,300 | $12,660 | $48,640 |
| 2024 | $3,494 | $54,630 | $11,280 | $43,350 |
| 2023 | $3,494 | $49,750 | $10,270 | $39,480 |
| 2022 | $3,208 | $45,890 | $9,470 | $36,420 |
| 2021 | $2,953 | $44,990 | $9,280 | $35,710 |
| 2020 | $2,958 | $43,260 | $8,920 | $34,340 |
| 2019 | $2,842 | $42,370 | $8,740 | $33,630 |
| 2018 | $3,212 | $41,700 | $8,600 | $33,100 |
| 2017 | $3,081 | $40,100 | $8,270 | $31,830 |
| 2016 | $2,752 | $39,270 | $8,100 | $31,170 |
| 2015 | $2,764 | $38,580 | $7,960 | $30,620 |
| 2014 | $2,741 | $38,580 | $7,960 | $30,620 |
| 2013 | $2,716 | $38,580 | $7,960 | $30,620 |
Source: Public Records
Map
Nearby Homes
- 33 Colony West Dr
- 1909 Melrose Dr Unit B
- 37 Ashley Ln
- 2404 N Nottingham Ct
- 2402 N Nottingham Ct
- 1805 Peach St
- 905 Barclay Ct
- 2311 Galen Dr Unit 10
- 1910 Augusta Dr
- 4 Greenfield Ct
- 408 Park Lane Dr
- 2706 N Salisbury Ct
- 1809 Augusta Dr
- 2208 O Donnell Dr
- 1105 Foothill Dr
- 2207 O Donnell Dr
- 1205 Broadmoor Dr
- 611 Ventura Rd
- 2417 Morrissey Park Dr Unit 2417
- 1705 Salem Rd
- 2135 Peach St Unit 2
- 2139 Peach St Unit 1
- 2114 Madison Ct
- 2138 Peach St Unit 2
- 2131 Peach St
- 2116 Madison Ct
- 2112 Madison Ct
- 809 Mendota Dr
- 811 Mendota Dr Unit B
- 807 Mendota Dr Unit B
- 805 Mendota Dr
- 2136 Peach St Unit 2136
- 2136 Peach St Unit 1
- 2129 Peach St Unit 2
- 2134 Peach St
- 813 Mendota Dr
- 2127 Peach St Unit 1
- 2118 Madison Ct
- 803 Mendota Dr
- 2132 Peach St Unit 1
Your Personal Tour Guide
Ask me questions while you tour the home.