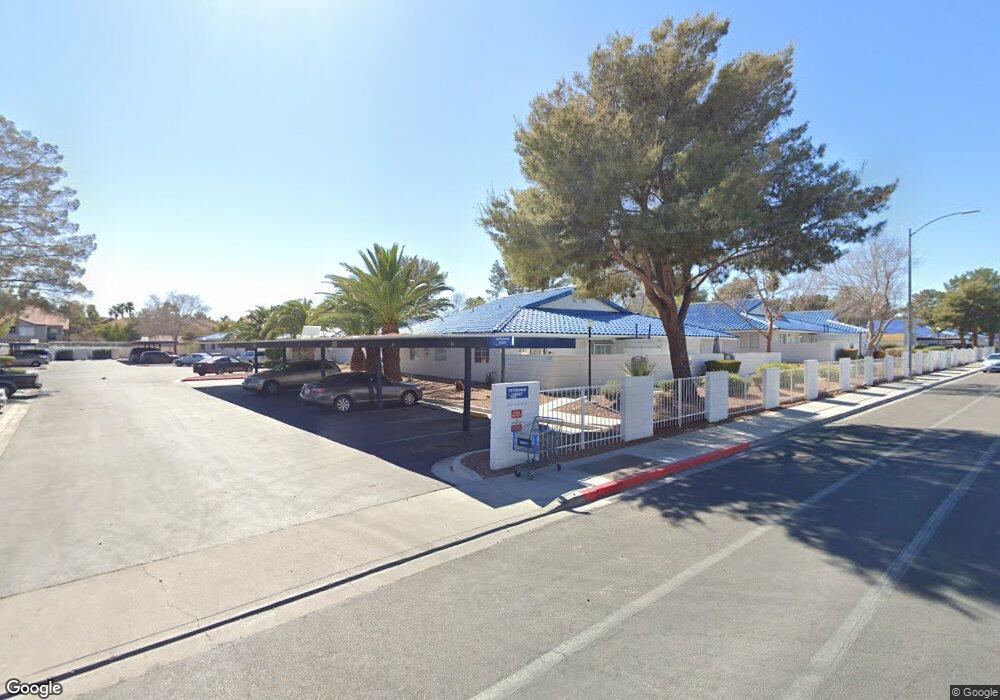
2137 Petersham Ct Unit A Las Vegas, NV 89108
Michael Way NeighborhoodEstimated Value: $195,410 - $223,000
2
Beds
2
Baths
728
Sq Ft
$293/Sq Ft
Est. Value
About This Home
This home is located at 2137 Petersham Ct Unit A, Las Vegas, NV 89108 and is currently estimated at $213,603, approximately $293 per square foot. 2137 Petersham Ct Unit A is a home located in Clark County with nearby schools including Lilly & Wing Fong Elementary School, J. Harold Brinley Middle School, and Cimarron Memorial High School.
Ownership History
Date
Name
Owned For
Owner Type
Purchase Details
Closed on
Dec 10, 2020
Sold by
Garcia Victor M
Bought by
Victor Manuel Garcia Trust and Garcia
Current Estimated Value
Purchase Details
Closed on
Aug 15, 2001
Sold by
Vanwynbergen Charles R
Bought by
Garcia Victor M
Home Financials for this Owner
Home Financials are based on the most recent Mortgage that was taken out on this home.
Original Mortgage
$72,261
Interest Rate
7.21%
Mortgage Type
FHA
Purchase Details
Closed on
Jun 15, 1999
Sold by
Carter Maria A
Bought by
Vanwynbergen Charles R
Purchase Details
Closed on
Jun 14, 1999
Sold by
Vanwynbergen Jan D
Bought by
Vanwynbergen Charles R
Purchase Details
Closed on
Mar 18, 1998
Sold by
Asberom Mona and Shaw Nettie F
Bought by
Carter Maria A
Create a Home Valuation Report for This Property
The Home Valuation Report is an in-depth analysis detailing your home's value as well as a comparison with similar homes in the area
Home Values in the Area
Average Home Value in this Area
Purchase History
| Date | Buyer | Sale Price | Title Company |
|---|---|---|---|
| Victor Manuel Garcia Trust | -- | None Listed On Document | |
| Garcia Victor M | $74,000 | Lawyers Title | |
| Vanwynbergen Charles R | $14,000 | Lawyers Title | |
| Vanwynbergen Charles R | -- | Lawyers Title | |
| Carter Maria A | $4,000 | -- |
Source: Public Records
Mortgage History
| Date | Status | Borrower | Loan Amount |
|---|---|---|---|
| Previous Owner | Garcia Victor M | $72,261 |
Source: Public Records
Tax History Compared to Growth
Tax History
| Year | Tax Paid | Tax Assessment Tax Assessment Total Assessment is a certain percentage of the fair market value that is determined by local assessors to be the total taxable value of land and additions on the property. | Land | Improvement |
|---|---|---|---|---|
| 2025 | $605 | $35,225 | $15,295 | $19,930 |
| 2024 | $561 | $35,225 | $15,295 | $19,930 |
| 2023 | $398 | $38,323 | $19,618 | $18,705 |
| 2022 | $520 | $34,173 | $16,293 | $17,880 |
| 2021 | $482 | $29,508 | $14,298 | $15,210 |
| 2020 | $444 | $29,951 | $13,965 | $15,986 |
| 2019 | $431 | $27,742 | $11,970 | $15,772 |
| 2018 | $419 | $20,576 | $5,320 | $15,256 |
| 2017 | $669 | $20,397 | $5,040 | $15,357 |
| 2016 | $398 | $20,026 | $4,410 | $15,616 |
| 2015 | $396 | $16,412 | $3,150 | $13,262 |
| 2014 | $384 | $11,890 | $3,150 | $8,740 |
Source: Public Records
Map
Nearby Homes
- 2120 Chertsey Dr Unit D
- 2120 Chertsey Dr Unit C
- 2128 Chertsey Dr Unit C
- 2132 Chertsey Dr Unit B
- 2132 Chertsey Dr Unit D
- 2141 Twickenham Place Unit D
- 2121 Chertsey Dr Unit D
- 6457 Blue Blossom Ave
- 2140 Willowbury Dr Unit A
- 2108 Willowbury Dr Unit B
- 2120 Willowbury Dr Unit C
- 2112 Willowbury Dr Unit B
- 2204 Short Pine Dr
- 2140 Bavington Dr Unit B
- 2128 Bavington Dr Unit A
- 2116 Bavington Dr Unit C
- 2132 Bavington Dr Unit D
- 2132 Bavington Dr Unit B
- 2132 Bavington Dr Unit C
- 2136 Bavington Dr Unit A
- 2137 Petersham Ct Unit B
- 2137 Petersham Ct Unit D
- 2137 Petersham Ct Unit C
- 2140 Chertsey Dr Unit C
- 2140 Chertsey Dr Unit A
- 2140 Chertsey Dr Unit B
- 2140 Chertsey Dr Unit D
- 2133 Petersham Ct Unit D
- 2133 Petersham Ct Unit A
- 2133 Petersham Ct Unit B
- 2133 Petersham Ct Unit C
- 2120 Chertsey Dr Unit A
- 2120 Chertsey Dr Unit B
- 2128 Chertsey Dr Unit B
- 2128 Chertsey Dr Unit D
- 2128 Chertsey Dr Unit A
- 2136 Petersham Ct
- 2136 Petersham Ct Unit D
- 2136 Petersham Ct Unit A
- 2136 Petersham Ct Unit C