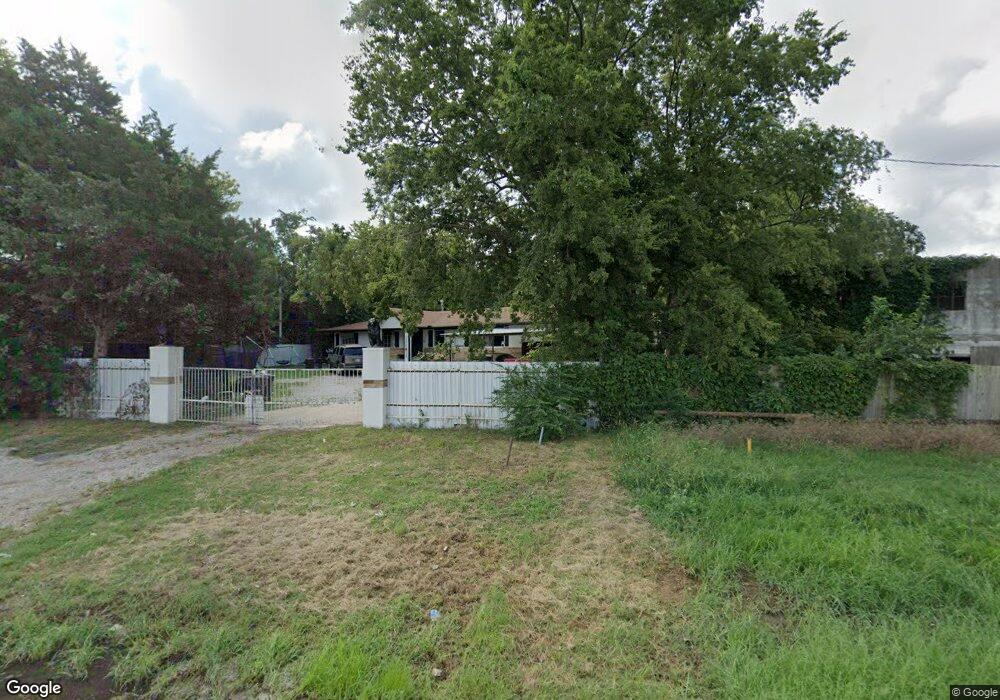
2138 Mohawk Blvd Tulsa, OK 74110
Lake Yahola NeighborhoodEstimated Value: $123,000 - $169,000
3
Beds
2
Baths
1,281
Sq Ft
$109/Sq Ft
Est. Value
About This Home
This home is located at 2138 Mohawk Blvd, Tulsa, OK 74110 and is currently estimated at $139,598, approximately $108 per square foot. 2138 Mohawk Blvd is a home located in Tulsa County with nearby schools including Anderson Elementary School, Monroe Demonstration Academy, and McLain High School of Science and Technology.
Ownership History
Date
Name
Owned For
Owner Type
Purchase Details
Closed on
Jul 19, 2022
Sold by
Escobedo and Teresa
Bought by
Escobedo Baltazar and Becerra Obdulia
Current Estimated Value
Purchase Details
Closed on
Nov 1, 2010
Sold by
Escobedo Baltazar and Becerra Perez Obdulia
Bought by
Escobedo Roberto and Hernandez Teresa
Purchase Details
Closed on
Sep 8, 2009
Sold by
Mckenney Negre M and Mckenney Gerran Q
Bought by
Deutsche Bank National Trust Company
Purchase Details
Closed on
Apr 25, 2003
Sold by
Mccondichie Loretha B and Earls Loretha B
Bought by
Mckenney Negre M and Mckenney Gerran Q
Home Financials for this Owner
Home Financials are based on the most recent Mortgage that was taken out on this home.
Original Mortgage
$53,200
Interest Rate
11.7%
Mortgage Type
Purchase Money Mortgage
Purchase Details
Closed on
Mar 1, 2000
Sold by
Burnett Walter F and Burnett Evelyn M
Bought by
Mccondichie Loretha B
Purchase Details
Closed on
Nov 1, 1991
Create a Home Valuation Report for This Property
The Home Valuation Report is an in-depth analysis detailing your home's value as well as a comparison with similar homes in the area
Home Values in the Area
Average Home Value in this Area
Purchase History
| Date | Buyer | Sale Price | Title Company |
|---|---|---|---|
| Escobedo Baltazar | -- | None Listed On Document | |
| Escobedo Roberto | -- | Tulsa Abstract & Title Co | |
| Deutsche Bank National Trust Company | -- | None Available | |
| Mckenney Negre M | $66,500 | -- | |
| Mccondichie Loretha B | $40,000 | -- | |
| -- | $30,000 | -- |
Source: Public Records
Mortgage History
| Date | Status | Borrower | Loan Amount |
|---|---|---|---|
| Previous Owner | Mckenney Negre M | $53,200 |
Source: Public Records
Tax History Compared to Growth
Tax History
| Year | Tax Paid | Tax Assessment Tax Assessment Total Assessment is a certain percentage of the fair market value that is determined by local assessors to be the total taxable value of land and additions on the property. | Land | Improvement |
|---|---|---|---|---|
| 2024 | $829 | $6,760 | $557 | $6,203 |
| 2023 | $829 | $7,535 | $621 | $6,914 |
| 2022 | $842 | $6,315 | $598 | $5,717 |
| 2021 | $834 | $6,315 | $598 | $5,717 |
| 2020 | $823 | $6,315 | $598 | $5,717 |
| 2019 | $865 | $6,315 | $598 | $5,717 |
| 2018 | $867 | $6,315 | $598 | $5,717 |
| 2017 | $866 | $7,315 | $693 | $6,622 |
| 2016 | $848 | $7,315 | $693 | $6,622 |
| 2015 | $849 | $7,315 | $693 | $6,622 |
| 2014 | $841 | $7,315 | $693 | $6,622 |
Source: Public Records
Map
Nearby Homes
- 2323 N Atlanta Ave E
- 2209 E 31st Place N
- 3531 E 33rd St N
- 2940 N Gillette Ave
- 2916 N Lewis Ave
- 2415 E 29th St N
- 2523 E 28th St N
- 1915 E 27th St N
- 2425 E Apache St
- 2429 E Apache St
- 2401 E Apache St
- 2240 E Apache St
- 3868 N Delaware Ave
- 2525 N Xanthus Ave
- 2723 E 27th St N
- 1931 N Lewis Ave
- 0 E 39th Ct N
- 0 E 40th Place N
- 1550 E Apache St
- 2413 N Yorktown Ave
- 2134 Mohawk Blvd
- 2145 E 33rd St N
- 2205 E 33rd St N
- 2135 E 33rd St N
- 2123 Mohawk Blvd
- 2019 Mohawk Blvd
- 2202 E 33rd St N
- 2210 E 33rd St N
- 2218 E 33rd St N
- 2142 E 33rd St N
- 2224 E 33rd St N
- 3236 N Zunis Ave
- 2103 Mohawk Blvd
- 1930 Mohawk Blvd
- 2121 E 32nd St N
- 2225 E 32nd Place N
- 2105 E 32nd Place N
- 2231 E 32nd Place N
- 3220 N Zunis Ave
- 2235 E 32nd Place N