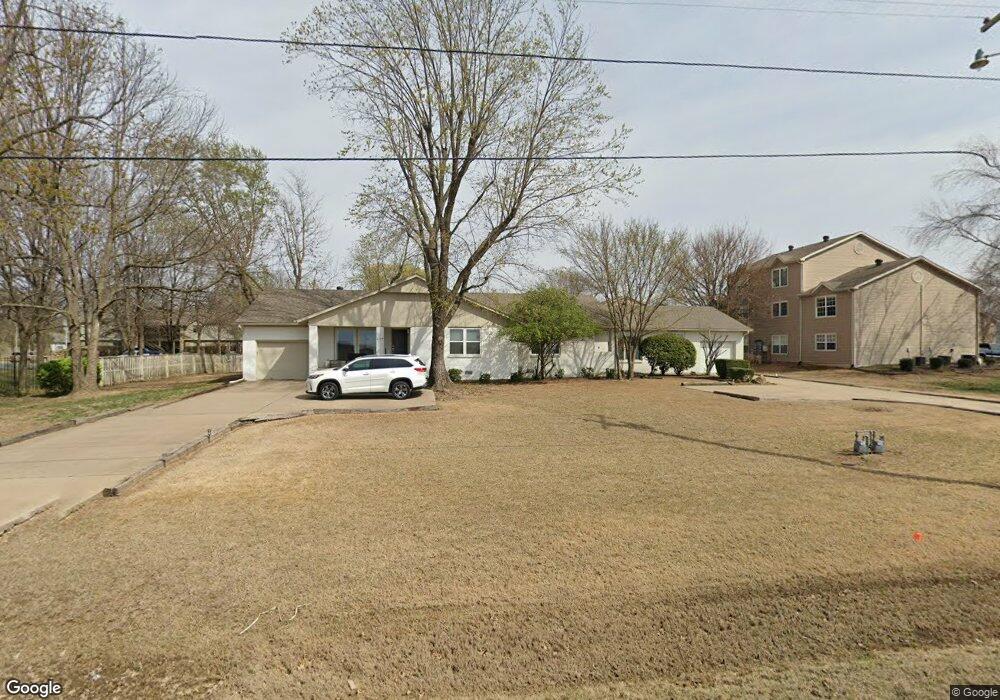
2138 N Garland Ave Unit 2138 Fayetteville, AR 72704
Downtown Fayetteville NeighborhoodEstimated Value: $182,000 - $198,407
--
Bed
2
Baths
1,056
Sq Ft
$178/Sq Ft
Est. Value
About This Home
This home is located at 2138 N Garland Ave Unit 2138, Fayetteville, AR 72704 and is currently estimated at $188,102, approximately $178 per square foot. 2138 N Garland Ave Unit 2138 is a home located in Washington County with nearby schools including Asbell Elementary School, Holt Middle School, and Woodland Junior High School.
Ownership History
Date
Name
Owned For
Owner Type
Purchase Details
Closed on
Aug 25, 2006
Sold by
Jc Realty Llc
Bought by
Martel John N and Martel Isis D
Current Estimated Value
Home Financials for this Owner
Home Financials are based on the most recent Mortgage that was taken out on this home.
Original Mortgage
$85,000
Outstanding Balance
$51,005
Interest Rate
6.75%
Mortgage Type
Purchase Money Mortgage
Estimated Equity
$137,097
Purchase Details
Closed on
Jan 16, 1995
Bought by
Kisor Jeffrey D
Purchase Details
Closed on
Oct 1, 1991
Bought by
Kisor, Doris Ann Rev Trus
Purchase Details
Closed on
Mar 28, 1991
Bought by
Kisor Bill R and Doris Ann
Purchase Details
Closed on
Oct 31, 1986
Bought by
Lindsey James E
Purchase Details
Closed on
Dec 6, 1985
Bought by
Bradford Place An Ar Gen and Bradford Place Ptn
Create a Home Valuation Report for This Property
The Home Valuation Report is an in-depth analysis detailing your home's value as well as a comparison with similar homes in the area
Home Values in the Area
Average Home Value in this Area
Purchase History
| Date | Buyer | Sale Price | Title Company |
|---|---|---|---|
| Martel John N | $85,000 | Heritage Land Title Of Ar | |
| Kisor Jeffrey D | $41,000 | -- | |
| Kisor, Doris Ann Rev Trus | -- | -- | |
| Kisor Bill R | $33,000 | -- | |
| Lindsey James E | $60,000 | -- | |
| Bradford Place An Ar Gen | -- | -- |
Source: Public Records
Mortgage History
| Date | Status | Borrower | Loan Amount |
|---|---|---|---|
| Open | Martel John N | $85,000 |
Source: Public Records
Tax History Compared to Growth
Tax History
| Year | Tax Paid | Tax Assessment Tax Assessment Total Assessment is a certain percentage of the fair market value that is determined by local assessors to be the total taxable value of land and additions on the property. | Land | Improvement |
|---|---|---|---|---|
| 2025 | $1,226 | $27,580 | $0 | $27,580 |
| 2024 | $1,130 | $27,580 | $0 | $27,580 |
| 2023 | $1,053 | $27,580 | $0 | $27,580 |
| 2022 | $958 | $21,360 | $0 | $21,360 |
| 2021 | $884 | $21,360 | $0 | $21,360 |
| 2020 | $810 | $21,360 | $0 | $21,360 |
| 2019 | $737 | $12,710 | $0 | $12,710 |
| 2018 | $737 | $12,710 | $0 | $12,710 |
| 2017 | $730 | $12,710 | $0 | $12,710 |
| 2016 | $730 | $12,710 | $0 | $12,710 |
| 2015 | $696 | $12,710 | $0 | $12,710 |
| 2014 | $420 | $14,330 | $0 | $14,330 |
Source: Public Records
Map
Nearby Homes
- 2190 N Garland Ave
- 838 W Peachtree Dr
- 2016 N Leverett Ave
- 1807 N Garland Ave
- 901 W Bel Air Dr
- 1766 N Janice Ave
- 0 W Davis St
- 6604 and 6640 W Davis St
- 1715 N Garland Ave
- 1882 N Scull Creek Dr
- 1878 N Scull Creek Dr
- 1865 N Scull Creek Dr
- 1866 N Scull Creek Dr Unit 6
- 966 W Sycamore St
- 1844 N Scull Creek Dr
- 1838 N Scull Creek Dr
- 1834 N Scull Creek Dr
- 1615 N Garland Ave
- 1429 and 1431 Deane St
- 402 W Poplar St
- 2138 N Garland Ave
- 2138 N Garland Ave Unit 21384
- 2138 N Garland Ave
- 2138 N Garland Ave Unit 2
- 2138 N Garland Ave Unit 21386
- 2138 N Garland Ave Unit 3
- 2138 Unit 6 Garland Ave
- 2130 Garland #6 St Unit 6
- 2130 N Garland Ave Unit 21305
- 2130 N Garland Ave Unit 4
- 2130 N Garland Ave Unit 3
- 2130 N Garland Ave Unit 2
- 2130 N Garland Ave Unit 1
- 2130 N Garland Ave Unit 6
- 2130 N Garland Ave Unit 5
- 2130 # 2 Garland St Unit 2
- 2128 N Garland Ave Unit 5
- 2128 N Garland Ave Unit 4
- 2128 N Garland Ave Unit 3
- 2128 N Garland Ave