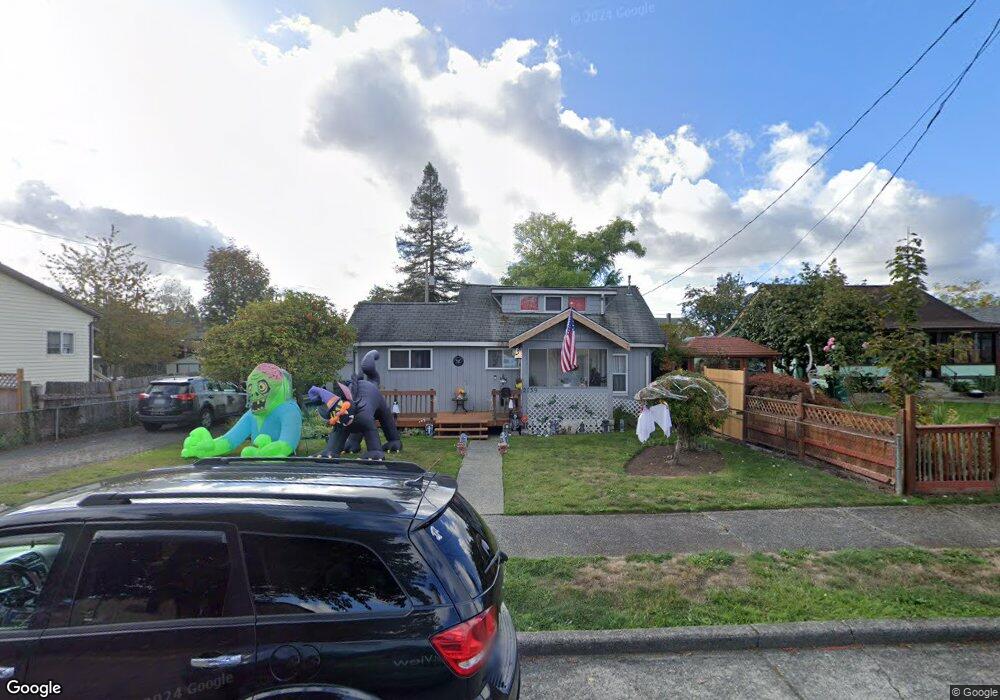
2139 8th St Bremerton, WA 98312
Charleston NeighborhoodEstimated Value: $279,000 - $325,718
3
Beds
1
Bath
1,104
Sq Ft
$273/Sq Ft
Est. Value
About This Home
This home is located at 2139 8th St, Bremerton, WA 98312 and is currently estimated at $301,180, approximately $272 per square foot. 2139 8th St is a home located in Kitsap County with nearby schools including Naval Avenue Elementary School, Mountain View Middle School, and Bremerton High School.
Ownership History
Date
Name
Owned For
Owner Type
Purchase Details
Closed on
Aug 25, 2005
Sold by
Laberge Andrew S
Bought by
Davis Brian M and Davis Heather D
Current Estimated Value
Home Financials for this Owner
Home Financials are based on the most recent Mortgage that was taken out on this home.
Original Mortgage
$96,000
Outstanding Balance
$57,909
Interest Rate
7.95%
Mortgage Type
Fannie Mae Freddie Mac
Estimated Equity
$243,271
Purchase Details
Closed on
Jan 21, 2003
Sold by
Abrams Wanda R
Bought by
Laberge Andrew S
Home Financials for this Owner
Home Financials are based on the most recent Mortgage that was taken out on this home.
Original Mortgage
$64,980
Interest Rate
5.96%
Mortgage Type
FHA
Purchase Details
Closed on
Feb 19, 2002
Sold by
Abrams Maxwell
Bought by
Abrams Wanda R
Create a Home Valuation Report for This Property
The Home Valuation Report is an in-depth analysis detailing your home's value as well as a comparison with similar homes in the area
Home Values in the Area
Average Home Value in this Area
Purchase History
| Date | Buyer | Sale Price | Title Company |
|---|---|---|---|
| Davis Brian M | $120,280 | Stewart Title Of Kitsap | |
| Laberge Andrew S | $66,000 | Land Title Company | |
| Abrams Wanda R | -- | Pacific Northwest Title |
Source: Public Records
Mortgage History
| Date | Status | Borrower | Loan Amount |
|---|---|---|---|
| Open | Davis Brian M | $96,000 | |
| Previous Owner | Laberge Andrew S | $64,980 |
Source: Public Records
Tax History
| Year | Tax Paid | Tax Assessment Tax Assessment Total Assessment is a certain percentage of the fair market value that is determined by local assessors to be the total taxable value of land and additions on the property. | Land | Improvement |
|---|---|---|---|---|
| 2026 | $1,880 | $213,020 | $79,150 | $133,870 |
| 2025 | $1,880 | $213,020 | $79,150 | $133,870 |
| 2024 | $1,814 | $213,020 | $79,150 | $133,870 |
| 2023 | $1,875 | $213,020 | $79,150 | $133,870 |
| 2022 | $1,744 | $178,130 | $65,960 | $112,170 |
| 2021 | $2,274 | $212,570 | $49,800 | $162,770 |
| 2020 | $2,113 | $197,420 | $46,090 | $151,330 |
| 2019 | $1,833 | $177,380 | $41,580 | $135,800 |
| 2018 | $1,892 | $120,710 | $31,260 | $89,450 |
| 2017 | $1,581 | $120,710 | $31,260 | $89,450 |
| 2016 | $1,482 | $107,100 | $27,420 | $79,680 |
| 2015 | $1,433 | $103,030 | $29,820 | $73,210 |
| 2014 | -- | $98,570 | $29,820 | $68,750 |
| 2013 | -- | $104,690 | $31,480 | $73,210 |
Source: Public Records
Map
Nearby Homes
Your Personal Tour Guide
Ask me questions while you tour the home.