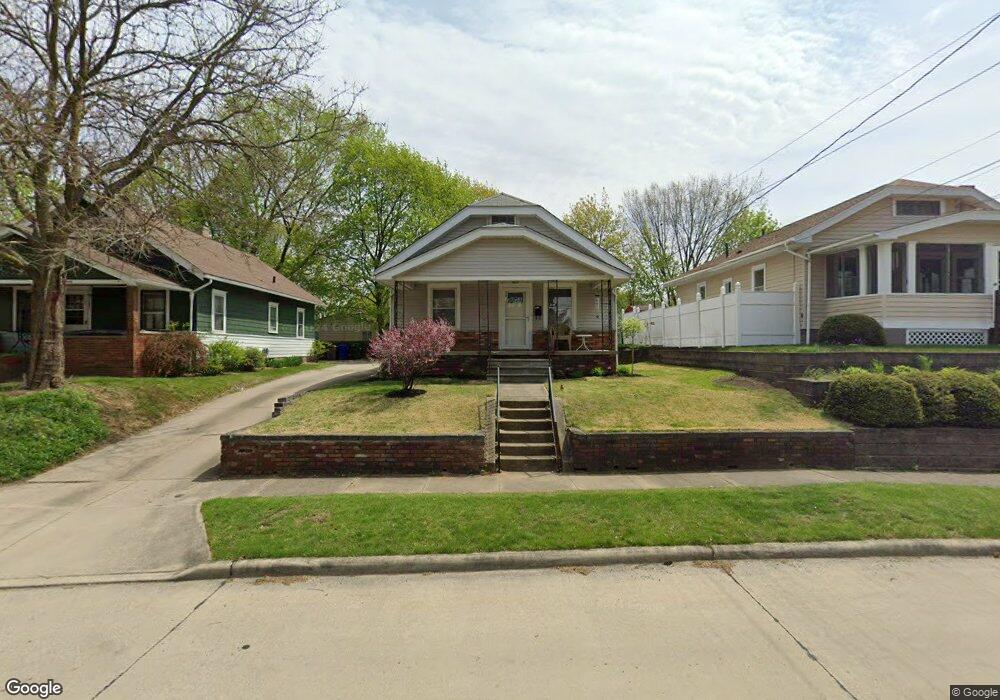
2139 9th St Cuyahoga Falls, OH 44221
Phelps Avenue NeighborhoodEstimated Value: $151,753 - $172,000
2
Beds
1
Bath
934
Sq Ft
$173/Sq Ft
Est. Value
About This Home
This home is located at 2139 9th St, Cuyahoga Falls, OH 44221 and is currently estimated at $161,438, approximately $172 per square foot. 2139 9th St is a home located in Summit County with nearby schools including Dewitt Elementary School, Bolich Middle School, and Cuyahoga Falls High School.
Ownership History
Date
Name
Owned For
Owner Type
Purchase Details
Closed on
Sep 25, 2023
Sold by
Kirk Tracey C
Bought by
Kirk Alan H and Kirk Tracey C
Current Estimated Value
Purchase Details
Closed on
Aug 31, 2023
Sold by
Kirk Tracey C
Bought by
Kirk Alan H and Kirk Tracey C
Purchase Details
Closed on
Jan 31, 2003
Sold by
Cunningham Harriet
Bought by
Workman Anita L
Create a Home Valuation Report for This Property
The Home Valuation Report is an in-depth analysis detailing your home's value as well as a comparison with similar homes in the area
Home Values in the Area
Average Home Value in this Area
Purchase History
| Date | Buyer | Sale Price | Title Company |
|---|---|---|---|
| Kirk Alan H | -- | None Listed On Document | |
| Kirk Alan H | -- | None Listed On Document | |
| Workman Anita L | $30,700 | -- |
Source: Public Records
Tax History Compared to Growth
Tax History
| Year | Tax Paid | Tax Assessment Tax Assessment Total Assessment is a certain percentage of the fair market value that is determined by local assessors to be the total taxable value of land and additions on the property. | Land | Improvement |
|---|---|---|---|---|
| 2025 | $2,256 | $40,849 | $9,328 | $31,521 |
| 2024 | $2,256 | $40,849 | $9,328 | $31,521 |
| 2023 | $2,256 | $40,849 | $9,328 | $31,521 |
| 2022 | $1,706 | $34,420 | $7,711 | $26,709 |
| 2021 | $1,706 | $34,420 | $7,711 | $26,709 |
| 2020 | $1,678 | $34,420 | $7,710 | $26,710 |
| 2019 | $1,716 | $32,660 | $7,550 | $25,110 |
| 2018 | $1,457 | $32,660 | $7,550 | $25,110 |
| 2017 | $1,287 | $32,660 | $7,550 | $25,110 |
| 2016 | $1,289 | $30,160 | $7,550 | $22,610 |
| 2015 | $1,287 | $30,160 | $7,550 | $22,610 |
| 2014 | $1,288 | $30,160 | $7,550 | $22,610 |
| 2013 | $1,284 | $30,270 | $7,550 | $22,720 |
Source: Public Records
Map
Nearby Homes