
Seller's Agent in 2025
Venessa James
Keller Williams Realty Professionals
(281) 889-8292
1 in this area
64 Total Sales
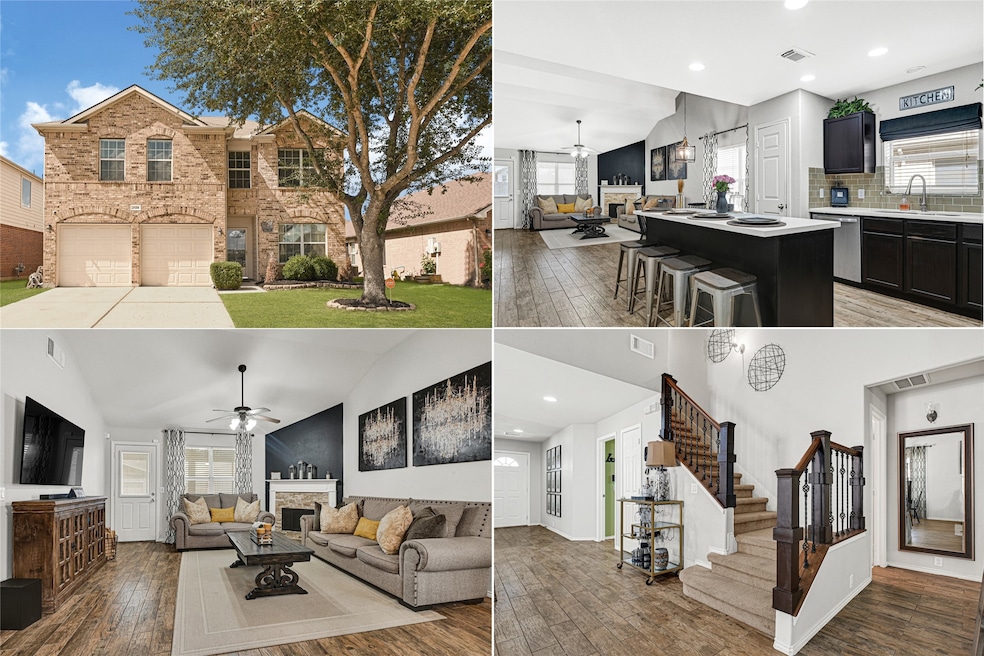


Beautiful and well-maintained 4-bedroom Pulte home offering a smart, versatile layout and modern finishes throughout. The open-concept living space features soaring ceilings, recessed lighting, and a cozy gas fireplace. The kitchen showcases quartz countertops, stainless steel appliances, and a glass mosaic subway tile backsplash, all centered around a spacious island. The primary suite is located downstairs with dual vanities, a soaking tub, and separate shower. Upstairs offers a game room and three generously sized bedrooms. A formal dining room at the front of the home provides flexible use as an office or creative space. Step outside to your private enclosed screened-in patio which is perfect for relaxing and enjoying the outdoors. Roof replaced in 2019. Conveniently located near Beltway 8 and I-10. Schedule a tour today!
Last Agent to Sell the Property
Keller Williams Realty Professionals License #0577417 Listed on: 10/12/2025
| Date | Type | Sale Price | Title Company |
|---|---|---|---|
| Deed | -- | None Listed On Document | |
| Warranty Deed | -- | -- | |
| Warranty Deed | -- | -- | |
| Vendors Lien | -- | First American Title |
| Date | Status | Loan Amount | Loan Type |
|---|---|---|---|
| Open | $271,503 | New Conventional | |
| Previous Owner | $120,208 | FHA | |
| Previous Owner | $136,566 | FHA |
| Date | Event | Price | List to Sale | Price per Sq Ft |
|---|---|---|---|---|
| 11/21/2025 11/21/25 | Sold | -- | -- | -- |
| 10/22/2025 10/22/25 | Pending | -- | -- | -- |
| 10/12/2025 10/12/25 | For Sale | $279,900 | -- | $122 / Sq Ft |
| Year | Tax Paid | Tax Assessment Tax Assessment Total Assessment is a certain percentage of the fair market value that is determined by local assessors to be the total taxable value of land and additions on the property. | Land | Improvement |
|---|---|---|---|---|
| 2025 | $4,269 | $254,140 | $47,373 | $206,767 |
| 2024 | $4,269 | $254,140 | $47,373 | $206,767 |
| 2023 | $4,269 | $269,473 | $47,373 | $222,100 |
| 2022 | $5,566 | $236,754 | $47,373 | $189,381 |
| 2021 | $5,294 | $202,213 | $47,373 | $154,840 |
| 2020 | $5,326 | $190,090 | $47,373 | $142,717 |
| 2019 | $4,968 | $173,660 | $36,441 | $137,219 |
| 2018 | $1,945 | $164,308 | $28,111 | $136,197 |
| 2017 | $4,787 | $164,308 | $28,111 | $136,197 |
| 2016 | $4,564 | $156,678 | $28,111 | $128,567 |
| 2015 | $3,827 | $151,640 | $20,303 | $131,337 |
| 2014 | $3,827 | $131,548 | $15,617 | $115,931 |
Seller's Agent in 2025
Venessa James
Keller Williams Realty Professionals
(281) 889-8292
1 in this area
64 Total Sales
Buyer's Agent in 2025
Alex Monsalve
Keller Williams Signature
(703) 869-8850
1 in this area
16 Total Sales
Source: Houston Association of REALTORS®
MLS Number: 65101383
APN: 1262890040010
Disclaimer: Certain information contained herein is derived from information provided by parties other than Homes.com. All information provided is deemed reliable, but is not guaranteed to be accurate and should be independently verified.
![]() Copyright 2026, Houston REALTORS® Information Service, Inc.
Copyright 2026, Houston REALTORS® Information Service, Inc.
The information provided is exclusively for consumers’ personal, non-commercial use, and may not be used for any purpose other than to identify prospective properties consumers may be interested in purchasing.
Information is deemed reliable but not guaranteed.
Ask me questions while you tour the home.