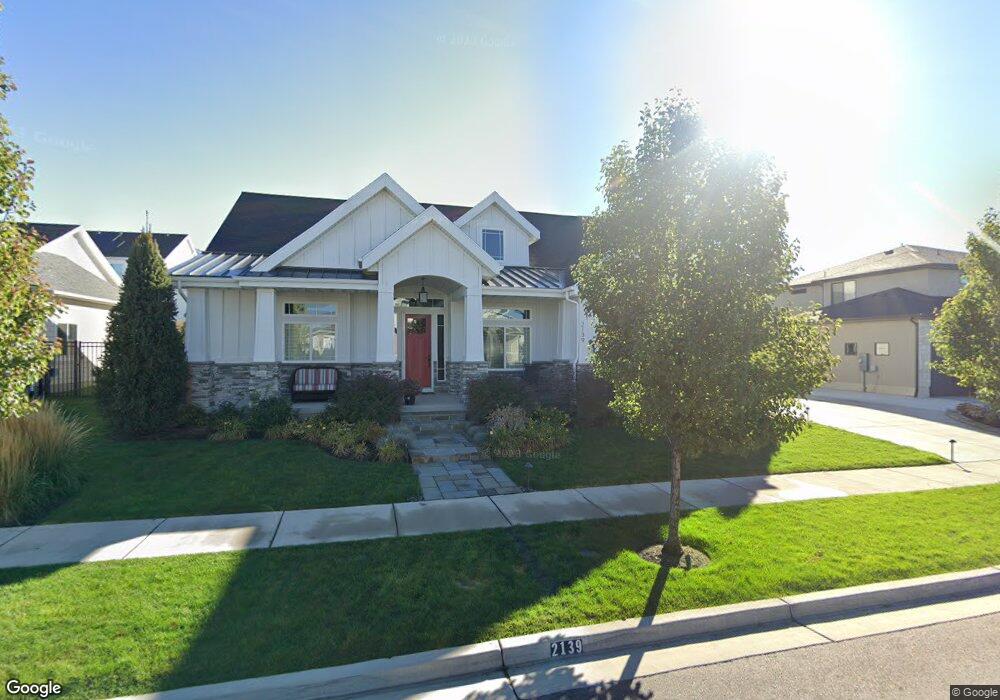
2139 S 60 W Orem, UT 84058
Lakeview NeighborhoodEstimated Value: $989,000 - $1,174,829
1
Bed
4
Baths
2,228
Sq Ft
$480/Sq Ft
Est. Value
About This Home
This home is located at 2139 S 60 W, Orem, UT 84058 and is currently estimated at $1,070,276, approximately $480 per square foot. 2139 S 60 W is a home with nearby schools including Cherry Hill Elementary School, Lakeridge Jr High School, and Mountain View High School.
Ownership History
Date
Name
Owned For
Owner Type
Purchase Details
Closed on
Apr 2, 2025
Sold by
Wilkinson Joel D and Wilkinson Sabrina Reed
Bought by
Joel And Sabrina Wilkinson Family Trust and Wilkinson
Current Estimated Value
Purchase Details
Closed on
Jul 17, 2020
Sold by
Wilkinson Joel D and Wilkinson Sabrina R
Bought by
Wilkinson Joel D and Wilkinson Sabrina Reed
Home Financials for this Owner
Home Financials are based on the most recent Mortgage that was taken out on this home.
Original Mortgage
$413,620
Interest Rate
3.2%
Mortgage Type
Commercial
Purchase Details
Closed on
Nov 17, 2016
Sold by
Legacy Ridge Llc
Bought by
Wilkinson Joel D and Wilkinson Sabrina R
Home Financials for this Owner
Home Financials are based on the most recent Mortgage that was taken out on this home.
Original Mortgage
$137,000
Interest Rate
3.47%
Mortgage Type
Balloon
Create a Home Valuation Report for This Property
The Home Valuation Report is an in-depth analysis detailing your home's value as well as a comparison with similar homes in the area
Home Values in the Area
Average Home Value in this Area
Purchase History
| Date | Buyer | Sale Price | Title Company |
|---|---|---|---|
| Joel And Sabrina Wilkinson Family Trust | -- | None Listed On Document | |
| Wilkinson Joel D | -- | Title Guarantee | |
| Wilkinson Joel D | -- | Access Title Co |
Source: Public Records
Mortgage History
| Date | Status | Borrower | Loan Amount |
|---|---|---|---|
| Previous Owner | Wilkinson Joel D | $413,620 | |
| Previous Owner | Wilkinson Joel D | $137,000 |
Source: Public Records
Tax History
| Year | Tax Paid | Tax Assessment Tax Assessment Total Assessment is a certain percentage of the fair market value that is determined by local assessors to be the total taxable value of land and additions on the property. | Land | Improvement |
|---|---|---|---|---|
| 2025 | $4,112 | $568,150 | -- | -- |
| 2024 | $4,112 | $502,755 | $0 | $0 |
| 2023 | $3,782 | $497,035 | $0 | $0 |
| 2022 | $3,661 | $466,125 | $0 | $0 |
| 2021 | $3,259 | $628,500 | $212,300 | $416,200 |
| 2020 | $3,065 | $581,000 | $184,600 | $396,400 |
| 2019 | $2,684 | $528,900 | $184,600 | $344,300 |
| 2018 | $2,682 | $505,000 | $184,600 | $320,400 |
| 2017 | $1,720 | $173,500 | $0 | $0 |
| 2016 | $1,865 | $173,500 | $0 | $0 |
Source: Public Records
Map
Nearby Homes
Your Personal Tour Guide
Ask me questions while you tour the home.