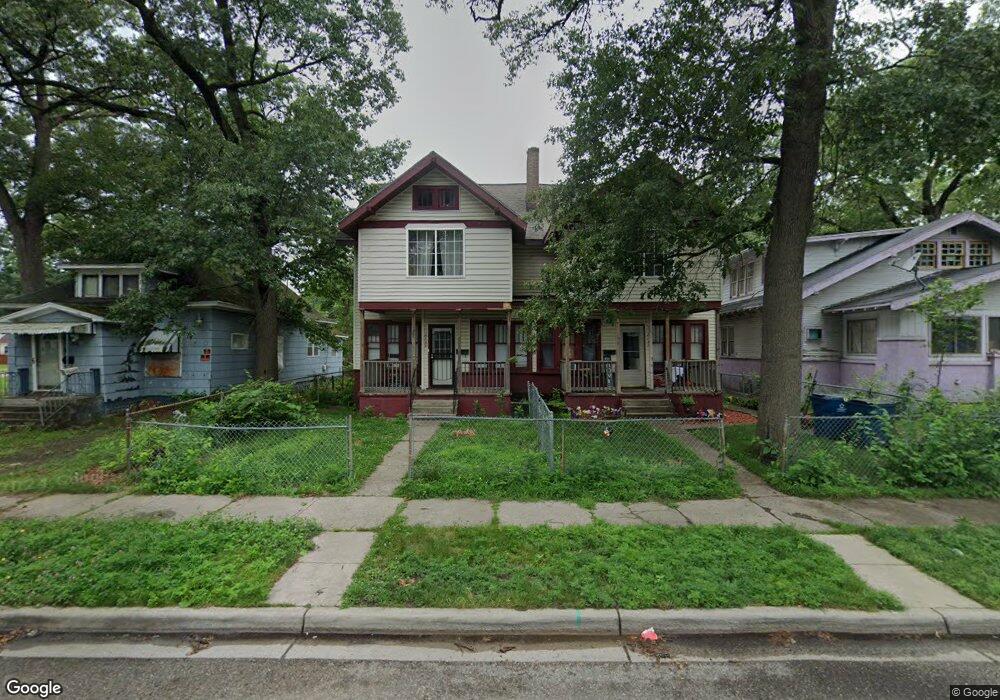
2139 Sanford St Muskegon, MI 49444
Estimated Value: $120,752 - $192,000
4
Beds
2
Baths
2,488
Sq Ft
$58/Sq Ft
Est. Value
About This Home
This home is located at 2139 Sanford St, Muskegon, MI 49444 and is currently estimated at $143,938, approximately $57 per square foot. 2139 Sanford St is a home located in Muskegon County with nearby schools including Muskegon Heights Academy, Muskegon Catholic Central School, and Broadway Baptist School.
Ownership History
Date
Name
Owned For
Owner Type
Purchase Details
Closed on
Aug 19, 2021
Sold by
Lee Linwood and Lee Louise
Bought by
Le Inc
Current Estimated Value
Purchase Details
Closed on
Oct 17, 2012
Sold by
Muskegon County Treasurer
Bought by
Lee Linwood and Lee Lousie
Purchase Details
Closed on
Dec 7, 2009
Sold by
Deutsche Bank National Trust Company
Bought by
Res Distressed Asset Fund Xxi Llc
Purchase Details
Closed on
Nov 21, 2008
Sold by
Jenkins Ronald and Jenkins Lutevies A
Bought by
Deutsche Bank National Trust Company
Create a Home Valuation Report for This Property
The Home Valuation Report is an in-depth analysis detailing your home's value as well as a comparison with similar homes in the area
Home Values in the Area
Average Home Value in this Area
Purchase History
| Date | Buyer | Sale Price | Title Company |
|---|---|---|---|
| Le Inc | -- | None Available | |
| Lee Linwood | $1,800 | None Available | |
| Res Distressed Asset Fund Xxi Llc | -- | None Available | |
| Deutsche Bank National Trust Company | $104,304 | None Available |
Source: Public Records
Tax History Compared to Growth
Tax History
| Year | Tax Paid | Tax Assessment Tax Assessment Total Assessment is a certain percentage of the fair market value that is determined by local assessors to be the total taxable value of land and additions on the property. | Land | Improvement |
|---|---|---|---|---|
| 2025 | $1,304 | $57,200 | $0 | $0 |
| 2024 | $967 | $38,500 | $0 | $0 |
| 2023 | $1,055 | $31,200 | $0 | $0 |
| 2022 | $1,440 | $29,600 | $0 | $0 |
| 2021 | $1,403 | $27,400 | $0 | $0 |
| 2020 | $1,389 | $24,000 | $0 | $0 |
| 2019 | $1,363 | $26,700 | $0 | $0 |
| 2018 | $1,553 | $23,800 | $0 | $0 |
| 2017 | $1,468 | $18,200 | $0 | $0 |
| 2016 | $1,077 | $17,000 | $0 | $0 |
| 2015 | -- | $20,800 | $0 | $0 |
| 2014 | -- | $22,400 | $0 | $0 |
| 2013 | -- | $21,800 | $0 | $0 |
Source: Public Records
Map
Nearby Homes
- 2133 Sanford St
- 2141 Sanford St
- 2129 Sanford St
- 2145 Sanford St
- 2136 Jefferson St
- 2134 Jefferson St
- 2140 Jefferson St
- 2125 Sanford St
- 2132 Jefferson St
- 2144 Jefferson St
- 2128 Jefferson St
- 0 Sanford St
- 2136 Sanford St
- 2132 Sanford St
- 2140 Sanford St
- 2144 Sanford St
- 2128 Sanford St
- 2201 Sanford St
- 2124 Sanford St
- 2120 Jefferson St