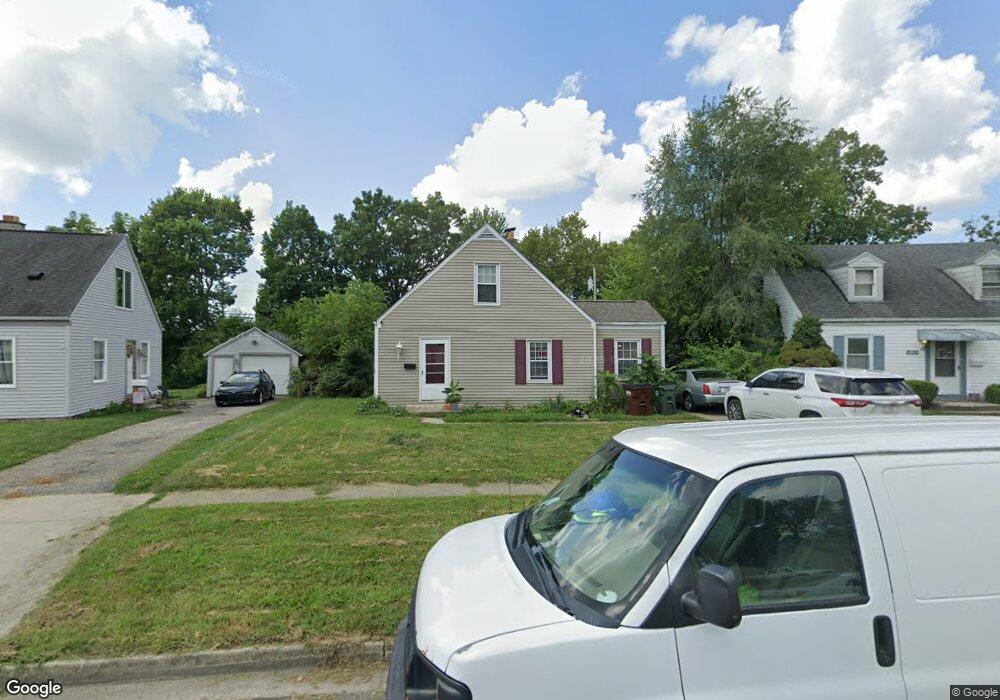
2139 W Bataan Dr Dayton, OH 45420
Estimated Value: $133,000 - $183,000
3
Beds
1
Bath
1,104
Sq Ft
$149/Sq Ft
Est. Value
About This Home
This home is located at 2139 W Bataan Dr, Dayton, OH 45420 and is currently estimated at $164,576, approximately $149 per square foot. 2139 W Bataan Dr is a home located in Montgomery County with nearby schools including Greenmont Elementary School, Kettering Middle School, and Kettering Fairmont High School.
Ownership History
Date
Name
Owned For
Owner Type
Purchase Details
Closed on
Nov 11, 2020
Sold by
Bailey Timothy David and Biltz Rachel Renee
Bought by
Vb One Llc
Current Estimated Value
Purchase Details
Closed on
Jan 25, 2008
Sold by
Va
Bought by
Bailey Timothy David and Biltz Rachel Renee
Home Financials for this Owner
Home Financials are based on the most recent Mortgage that was taken out on this home.
Original Mortgage
$67,183
Interest Rate
5.75%
Mortgage Type
Purchase Money Mortgage
Purchase Details
Closed on
Jun 20, 2007
Sold by
Rouse John W and Rouse Kristin A
Bought by
Va
Purchase Details
Closed on
Apr 30, 2001
Sold by
Dee Vaughn L and Friel Suzanne
Bought by
Rouse John W
Home Financials for this Owner
Home Financials are based on the most recent Mortgage that was taken out on this home.
Original Mortgage
$91,670
Interest Rate
6.95%
Mortgage Type
VA
Purchase Details
Closed on
Sep 26, 1994
Sold by
Combs Darlene K and Jones Darlene Kay
Bought by
Combs Ricky and Combs Darlene K
Create a Home Valuation Report for This Property
The Home Valuation Report is an in-depth analysis detailing your home's value as well as a comparison with similar homes in the area
Home Values in the Area
Average Home Value in this Area
Purchase History
| Date | Buyer | Sale Price | Title Company |
|---|---|---|---|
| Vb One Llc | $55,000 | Total Title Services Llc | |
| Bailey Timothy David | -- | Evans Title Agency Inc | |
| Va | $81,080 | None Available | |
| Rouse John W | $89,000 | -- | |
| Combs Ricky | -- | -- |
Source: Public Records
Mortgage History
| Date | Status | Borrower | Loan Amount |
|---|---|---|---|
| Previous Owner | Bailey Timothy David | $67,183 | |
| Previous Owner | Rouse John W | $91,670 |
Source: Public Records
Tax History
| Year | Tax Paid | Tax Assessment Tax Assessment Total Assessment is a certain percentage of the fair market value that is determined by local assessors to be the total taxable value of land and additions on the property. | Land | Improvement |
|---|---|---|---|---|
| 2025 | $2,867 | $43,500 | $11,010 | $32,490 |
| 2024 | $2,789 | $43,500 | $11,010 | $32,490 |
| 2023 | $2,789 | $43,500 | $11,010 | $32,490 |
| 2022 | $2,585 | $30,370 | $7,700 | $22,670 |
| 2021 | $2,239 | $30,370 | $7,700 | $22,670 |
| 2020 | $2,421 | $30,370 | $7,700 | $22,670 |
| 2019 | $2,578 | $27,690 | $7,700 | $19,990 |
| 2018 | $2,327 | $27,690 | $7,700 | $19,990 |
| 2017 | $2,276 | $27,690 | $7,700 | $19,990 |
| 2016 | $2,011 | $24,350 | $7,700 | $16,650 |
| 2015 | $2,005 | $24,350 | $7,700 | $16,650 |
| 2014 | $2,005 | $24,350 | $7,700 | $16,650 |
| 2012 | -- | $25,760 | $8,400 | $17,360 |
Source: Public Records
Map
Nearby Homes
- 2216 Culver Ave
- 2040 Courtland Ave
- 2291 Patterson Rd
- 2408 Homeland Ct
- 2105 Pittsfield St
- 1841 Courtland Ave
- 2004 Hazel Ave
- 1534 Horlacher Ave
- 1618 Briedweng Ave Unit 1616
- 1513 Horlacher Ave
- 1629 Beaver Creek Ln
- 1814 Ewalt Ave
- 1521 Beaver Creek Ln
- 2618 Kennedy Ave
- 1436 Glenn Abbey Dr
- 3019 Dwight Ave
- 2758 Sutton Ave
- 2971 Peony Place
- 3005 La Plata Dr
- 2425 Wilmington Pike
- 2135 W Bataan Dr
- 2143 W Bataan Dr
- 2147 W Bataan Dr
- 2131 W Bataan Dr
- 2151 W Bataan Dr
- 2127 W Bataan Dr
- 2132 W Bataan Dr
- 2138 W Bataan Dr
- 2126 W Bataan Dr
- 2144 W Bataan Dr
- 2155 W Bataan Dr
- 2123 W Bataan Dr
- 2120 W Bataan Dr
- 2150 W Bataan Dr
- 2119 W Bataan Dr
- 2156 W Bataan Dr
- 2116 W Bataan Dr
- 2208 Woodman Dr
- 2207 Whitney Place
- 2217 Whitney Place
Your Personal Tour Guide
Ask me questions while you tour the home.