2139 W Jordan Villa Dr Unit 6A West Jordan, UT 84088
Estimated Value: $456,000 - $485,097
2
Beds
2
Baths
1,570
Sq Ft
$301/Sq Ft
Est. Value
About This Home
This home is located at 2139 W Jordan Villa Dr Unit 6A, West Jordan, UT 84088 and is currently estimated at $472,274, approximately $300 per square foot. 2139 W Jordan Villa Dr Unit 6A is a home located in Salt Lake County with nearby schools including Westvale Elementary School, West Jordan Middle School, and West Jordan High School.
Ownership History
Date
Name
Owned For
Owner Type
Purchase Details
Closed on
Feb 21, 2019
Sold by
Nelson Allan H and Nelson Emma Ann
Bought by
Nelson Allan Harold and Nelson Emma Ann
Current Estimated Value
Purchase Details
Closed on
Oct 25, 2018
Sold by
Harris William Joseph
Bought by
Nelson Allan H and Nelson Emma Ann
Purchase Details
Closed on
Jul 15, 2015
Sold by
Wallace Myrna and Harris William Joseph
Bought by
Myrna Ann Harris Trust
Purchase Details
Closed on
Oct 15, 2012
Sold by
Ludlow Hal A and Ludlow Enger P
Bought by
Wallace Myria and Harris Willaim J
Purchase Details
Closed on
Apr 29, 2004
Sold by
Johanson Patty Jo
Bought by
Ludlow Hal A and Ludlow Inger P
Purchase Details
Closed on
Jul 25, 2002
Sold by
Leisure Villas Inc
Bought by
Ball Elaine
Create a Home Valuation Report for This Property
The Home Valuation Report is an in-depth analysis detailing your home's value as well as a comparison with similar homes in the area
Home Values in the Area
Average Home Value in this Area
Purchase History
| Date | Buyer | Sale Price | Title Company |
|---|---|---|---|
| Nelson Allan Harold | -- | None Available | |
| Nelson Allan H | -- | Title One | |
| Myrna Ann Harris Trust | -- | None Available | |
| Wallace Myria | -- | 1St Liberty Title Lc | |
| Ludlow Hal A | -- | Merrill Title | |
| Ball Elaine | -- | Merrill Title |
Source: Public Records
Tax History Compared to Growth
Tax History
| Year | Tax Paid | Tax Assessment Tax Assessment Total Assessment is a certain percentage of the fair market value that is determined by local assessors to be the total taxable value of land and additions on the property. | Land | Improvement |
|---|---|---|---|---|
| 2025 | -- | $472,000 | $141,600 | $330,400 |
| 2024 | -- | $460,300 | $138,100 | $322,200 |
| 2023 | $786 | $447,200 | $134,100 | $313,100 |
| 2022 | $786 | $487,000 | $146,100 | $340,900 |
| 2021 | $2,999 | $356,000 | $106,800 | $249,200 |
| 2020 | $105 | $339,700 | $101,900 | $237,800 |
| 2019 | $2,100 | $313,800 | $94,100 | $219,700 |
| 2018 | $0 | $293,200 | $90,100 | $203,100 |
| 2017 | $1,869 | $275,800 | $82,700 | $193,100 |
| 2016 | $1,799 | $249,400 | $74,800 | $174,600 |
| 2015 | $1,756 | $237,400 | $71,200 | $166,200 |
| 2014 | $1,766 | $235,000 | $70,500 | $164,500 |
Source: Public Records
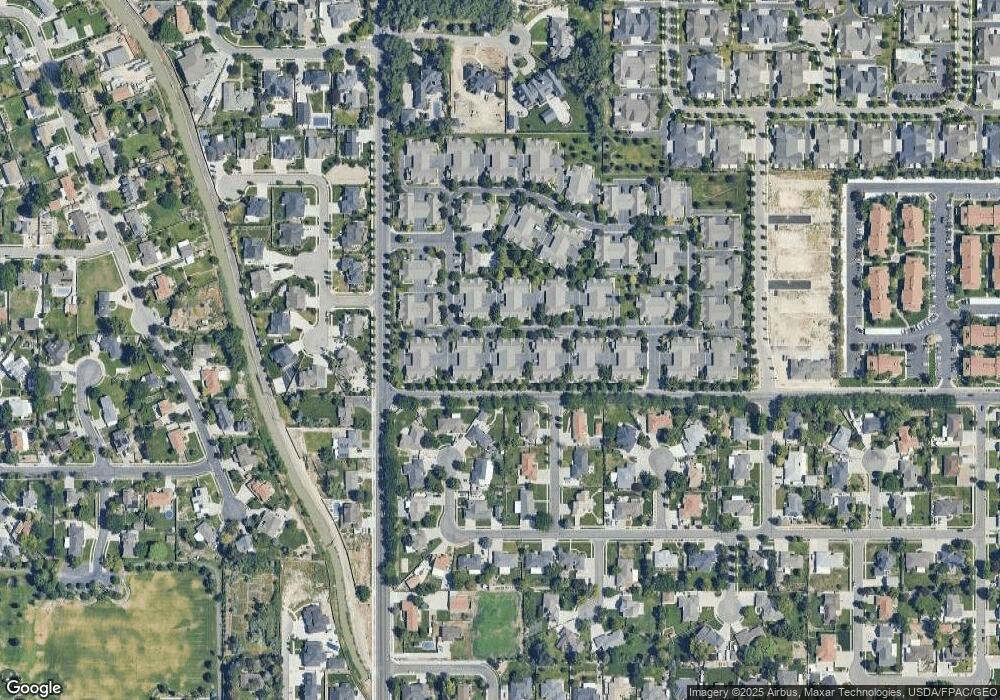
Map
Nearby Homes
- 2097 Jordan Villa Dr
- 2116 W Abbey View Rd
- 2177 W 9240 S
- 9414 S 1980 W
- 9252 S 2040 W Unit D
- 1968 W 9270 S Unit C
- 2223 W Williamsburg Cir
- 9496 S 1930 W
- 2286 Williamsburg Cir
- 1753 Rylie Ann Cir
- 9511 S Tirado Cove Unit 204
- Brook Haven Plan at Jordan Woods
- Maple Plan at Jordan Woods
- The Maple Basement Plan at Jordan Woods
- The Evergreen Basement Plan at Jordan Woods
- 9503 S Tirado Cove Unit 203
- 1719 W Brocious Way Unit 301
- 9178 Lisa Ave
- 1673 Peaceful Cir
- 1741 W Nikos Ln
- 2139 Jordan Villa Dr
- 2129 Jordan Villa Dr
- 2137 Jordan Villa Dr
- 2131 Jordan Villa Dr
- 2131 W Jordan Villa Dr
- 2149 W Jordan Villa Dr
- 2149 Jordan Villa Dr
- 2151 Jordan Villa Dr
- 2136 Jordan Villa Dr
- 2117 Jordan Villa Dr
- 2117 W Jordan Villa Dr
- 2159 W Jordan Villa Dr
- 2124 W Jordan Villa Dr
- 2124 Jordan Villa Dr
- 2159 Jordan Villa Dr
- 2146 W Jordan Villa Dr Unit 12A
- 2146 Jordan Villa Dr
- 2113 Jordan Villa Dr
- 2157 Jordan Villa Dr
- 2156 Jordan Villa Dr