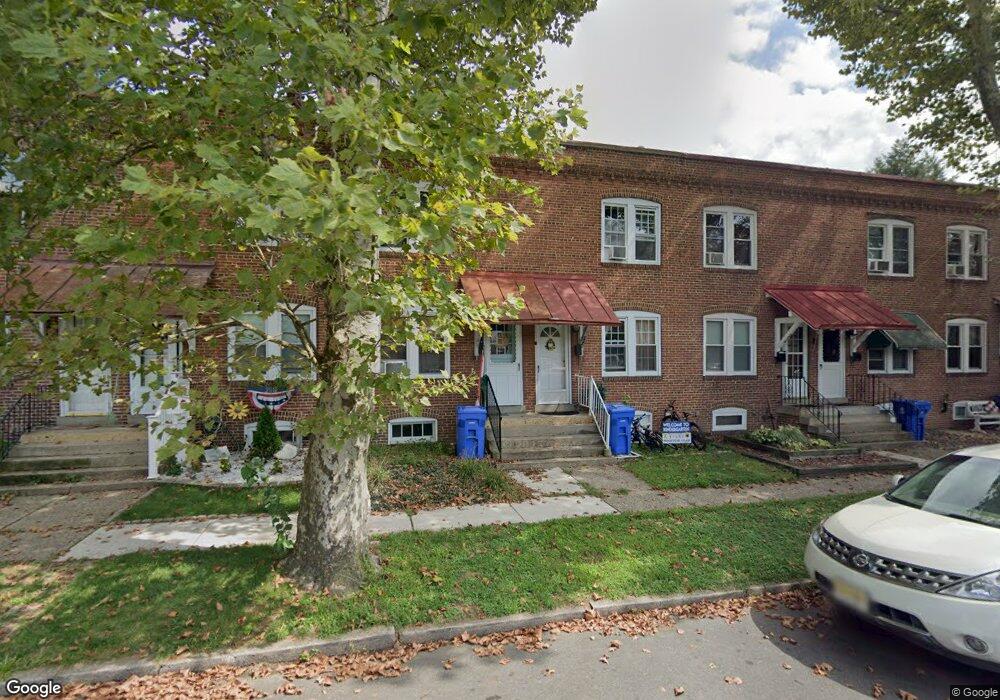
214 6th Ave Roebling, NJ 08554
Estimated Value: $177,575 - $272,000
--
Bed
--
Bath
1,140
Sq Ft
$199/Sq Ft
Est. Value
About This Home
This home is located at 214 6th Ave, Roebling, NJ 08554 and is currently estimated at $226,894, approximately $199 per square foot. 214 6th Ave is a home located in Burlington County with nearby schools including Number 5, Roebling Elementary School, Riverfront Middle School, and Florence Twp Mem High School.
Ownership History
Date
Name
Owned For
Owner Type
Purchase Details
Closed on
Apr 28, 2006
Sold by
Baldorossi Frank K and Baldorossi Theresa H
Bought by
Baldorossi Frank K
Current Estimated Value
Home Financials for this Owner
Home Financials are based on the most recent Mortgage that was taken out on this home.
Original Mortgage
$63,000
Outstanding Balance
$36,529
Interest Rate
6.42%
Mortgage Type
Fannie Mae Freddie Mac
Estimated Equity
$190,365
Purchase Details
Closed on
Dec 30, 1998
Sold by
Gotsch John W and Grant Nancy
Bought by
Baldorossi Francis K and Baldorossi Theresa H
Home Financials for this Owner
Home Financials are based on the most recent Mortgage that was taken out on this home.
Original Mortgage
$35,100
Interest Rate
6.8%
Create a Home Valuation Report for This Property
The Home Valuation Report is an in-depth analysis detailing your home's value as well as a comparison with similar homes in the area
Home Values in the Area
Average Home Value in this Area
Purchase History
| Date | Buyer | Sale Price | Title Company |
|---|---|---|---|
| Baldorossi Frank K | -- | General Abstract & Title Age | |
| Baldorossi Francis K | $39,000 | -- |
Source: Public Records
Mortgage History
| Date | Status | Borrower | Loan Amount |
|---|---|---|---|
| Open | Baldorossi Frank K | $63,000 | |
| Previous Owner | Baldorossi Francis K | $35,100 |
Source: Public Records
Tax History Compared to Growth
Tax History
| Year | Tax Paid | Tax Assessment Tax Assessment Total Assessment is a certain percentage of the fair market value that is determined by local assessors to be the total taxable value of land and additions on the property. | Land | Improvement |
|---|---|---|---|---|
| 2025 | $3,085 | $110,700 | $44,300 | $66,400 |
| 2024 | $2,953 | $110,700 | $44,300 | $66,400 |
| 2023 | $2,953 | $110,700 | $44,300 | $66,400 |
| 2022 | $2,890 | $110,700 | $44,300 | $66,400 |
| 2021 | $2,865 | $110,700 | $44,300 | $66,400 |
| 2020 | $2,854 | $110,700 | $44,300 | $66,400 |
| 2019 | $2,828 | $110,700 | $44,300 | $66,400 |
| 2018 | $2,804 | $110,700 | $44,300 | $66,400 |
| 2017 | $2,770 | $110,700 | $44,300 | $66,400 |
| 2016 | $2,717 | $110,700 | $44,300 | $66,400 |
| 2015 | $2,661 | $110,700 | $44,300 | $66,400 |
| 2014 | $3,054 | $130,700 | $44,300 | $86,400 |
Source: Public Records
Map
Nearby Homes