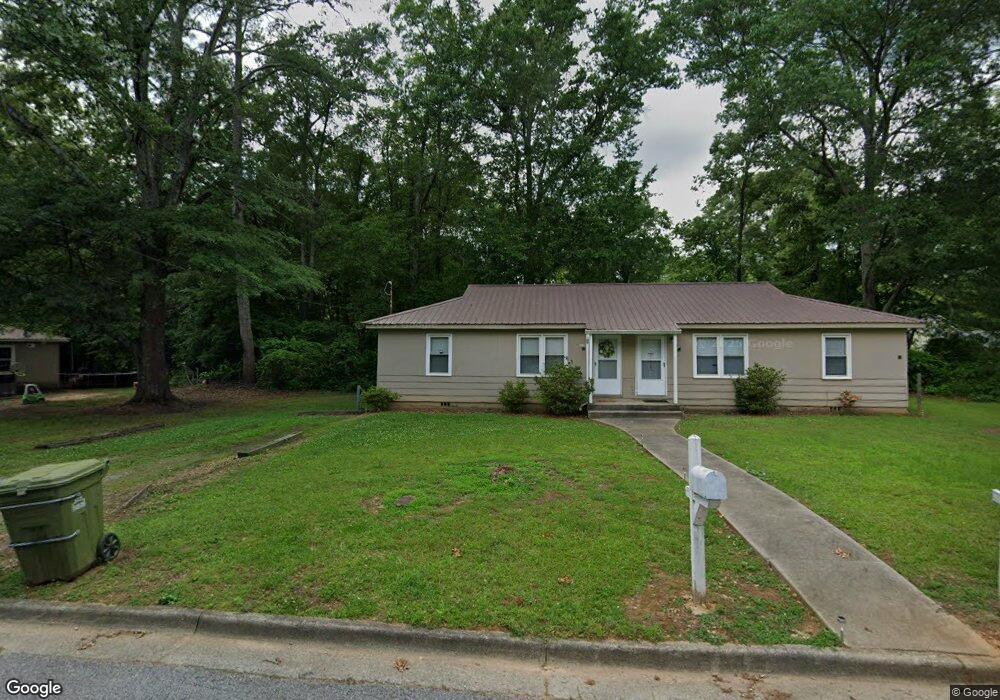
214 Bass St Unit 216 Carrollton, GA 30117
Estimated Value: $208,419 - $244,000
4
Beds
2
Baths
1,539
Sq Ft
$145/Sq Ft
Est. Value
About This Home
This home is located at 214 Bass St Unit 216, Carrollton, GA 30117 and is currently estimated at $223,855, approximately $145 per square foot. 214 Bass St Unit 216 is a home located in Carroll County with nearby schools including Carrollton Elementary School, Carrollton Upper Elementary School, and Carrollton Middle School.
Ownership History
Date
Name
Owned For
Owner Type
Purchase Details
Closed on
Sep 10, 2020
Sold by
Gts Holdings Llc
Bought by
Ejsd Properties Llc
Current Estimated Value
Purchase Details
Closed on
May 13, 2010
Sold by
Waldrep Pierce
Bought by
Gts Holdings Llc
Purchase Details
Closed on
Mar 22, 2010
Sold by
Aurora Loan Svcs Llc
Bought by
Waldrep Pierce
Purchase Details
Closed on
Jan 5, 2010
Sold by
Swindle Jeanne
Bought by
Aurora Loan Svcs Llc
Purchase Details
Closed on
Jun 20, 2006
Sold by
Not Provided
Bought by
Gts Holdings Llc
Purchase Details
Closed on
Apr 29, 2002
Sold by
Swindle Mark S
Bought by
Swindle Mark S and Swindle Jeanne
Purchase Details
Closed on
Apr 28, 2002
Sold by
M C & B Properties L
Bought by
Swindle Mark S
Purchase Details
Closed on
Mar 20, 1997
Bought by
M C & B Properties L
Create a Home Valuation Report for This Property
The Home Valuation Report is an in-depth analysis detailing your home's value as well as a comparison with similar homes in the area
Home Values in the Area
Average Home Value in this Area
Purchase History
| Date | Buyer | Sale Price | Title Company |
|---|---|---|---|
| Ejsd Properties Llc | $514,675 | -- | |
| Gts Holdings Llc | -- | -- | |
| Waldrep Pierce | $24,900 | -- | |
| Aurora Loan Svcs Llc | $92,940 | -- | |
| Aurora Loan Svcs Llc | $92,940 | -- | |
| Gts Holdings Llc | -- | -- | |
| Swindle Mark S | -- | -- | |
| Swindle Mark S | $400,000 | -- | |
| M C & B Properties L | -- | -- |
Source: Public Records
Tax History Compared to Growth
Tax History
| Year | Tax Paid | Tax Assessment Tax Assessment Total Assessment is a certain percentage of the fair market value that is determined by local assessors to be the total taxable value of land and additions on the property. | Land | Improvement |
|---|---|---|---|---|
| 2024 | $1,330 | $48,670 | $9,018 | $39,652 |
| 2023 | $1,330 | $45,006 | $9,018 | $35,988 |
| 2022 | $1,020 | $34,958 | $6,002 | $28,956 |
| 2021 | $856 | $29,332 | $4,435 | $24,897 |
| 2020 | $788 | $26,981 | $4,435 | $22,546 |
| 2019 | $745 | $25,250 | $4,435 | $20,815 |
| 2018 | $696 | $23,264 | $4,435 | $18,829 |
| 2017 | $700 | $23,264 | $4,435 | $18,829 |
| 2016 | $704 | $23,264 | $4,435 | $18,829 |
| 2015 | $691 | $22,377 | $6,000 | $16,378 |
| 2014 | $694 | $22,378 | $6,000 | $16,378 |
Source: Public Records
Map
Nearby Homes
- 114 Bennett Cir
- 119 Oxford Square
- 120 Stewart St
- 201 Stewart St
- 322 Cedar St
- 406 Harmon Ave
- 317 Bledsoe St
- 521 Adamson Ave
- 509 Adamson Ave
- Plan 2121 at Canterbury Villas
- Plan 2307 at Canterbury Villas
- 204 Chaucer Ln
- Plan 1522 at Canterbury Villas
- Plan 1634 at Canterbury Villas
- Plan 2628 at Canterbury Villas
- 112 Lane Dr
- 112 Lane Dr Unit LOT 68
- 202 Laney Dr
- 150 Adamson Dr
- 210 Lane Dr Unit LOT 61
- 634 West Ave
- 210 Bass St Unit 212
- 223 Bass St Unit 225
- 223 Bass St
- 0 Bass St Unit 8381946
- 219 Bass St
- 129 Belva St
- 207 Belva St
- 110 Jackson St
- 630 West Ave
- 630 West Ave Unit A
- 630 West Ave Unit B
- 127 Belva St
- 206 Bass St Unit 208
- 0 Jackson St Unit 7032661
- 0 Jackson St Unit 8633923
- 0 Jackson St
- 624 West Ave
- 207 Bass St
- 203 Belva St