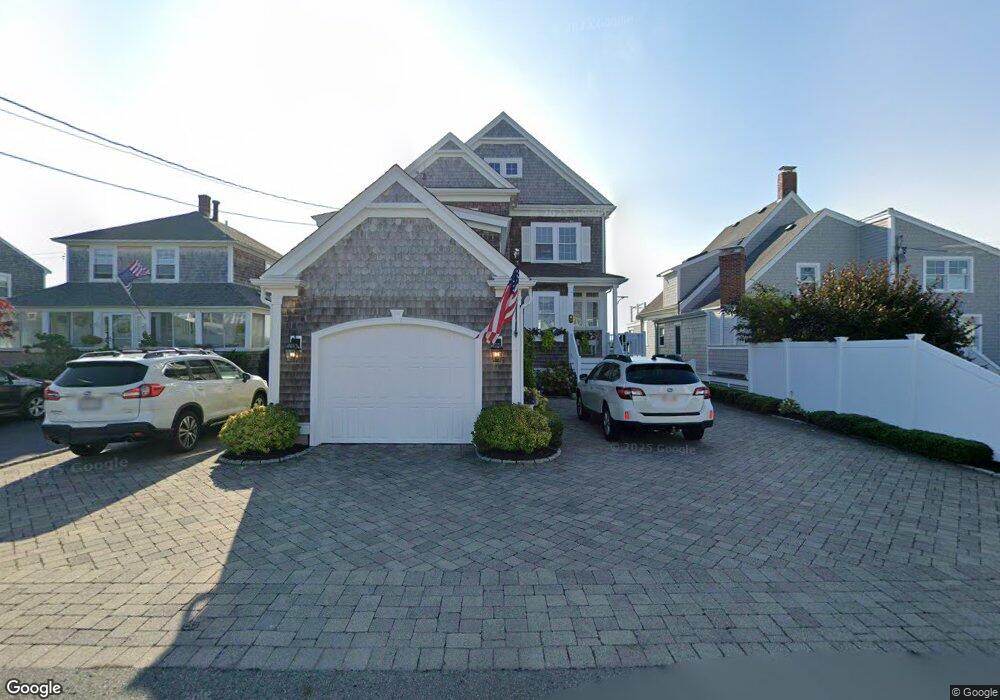
214 Bay Ave Marshfield, MA 02050
Green Harbor-Cedar Crest NeighborhoodEstimated Value: $690,000 - $1,769,000
3
Beds
2
Baths
1,364
Sq Ft
$1,060/Sq Ft
Est. Value
About This Home
This home is located at 214 Bay Ave, Marshfield, MA 02050 and is currently estimated at $1,445,219, approximately $1,059 per square foot. 214 Bay Ave is a home located in Plymouth County with nearby schools including Governor Edward Winslow School, Furnace Brook Middle School, and Marshfield High School.
Ownership History
Date
Name
Owned For
Owner Type
Purchase Details
Closed on
Jul 1, 2021
Sold by
Jr Ft and Bagnall
Bought by
Robert T Bagnall T T and Robert Bagnall
Current Estimated Value
Purchase Details
Closed on
Jun 20, 2008
Sold by
Shell Lane T
Bought by
Bagnall Tr Robert T and Bagnall Janis E
Purchase Details
Closed on
Dec 28, 2007
Sold by
Madden George J
Bought by
Shell Lane T
Create a Home Valuation Report for This Property
The Home Valuation Report is an in-depth analysis detailing your home's value as well as a comparison with similar homes in the area
Home Values in the Area
Average Home Value in this Area
Purchase History
| Date | Buyer | Sale Price | Title Company |
|---|---|---|---|
| Robert T Bagnall T T | -- | None Available | |
| Robert T Bagnall T T | -- | None Available | |
| Bagnall Tr Robert T | -- | -- | |
| Bagnall Tr Robert T | -- | -- | |
| Shell Lane T | $700,000 | -- | |
| Shell Lane T | $700,000 | -- |
Source: Public Records
Mortgage History
| Date | Status | Borrower | Loan Amount |
|---|---|---|---|
| Previous Owner | Shell Lane T | $35,000 | |
| Previous Owner | Shell Lane T | $100,000 |
Source: Public Records
Tax History Compared to Growth
Tax History
| Year | Tax Paid | Tax Assessment Tax Assessment Total Assessment is a certain percentage of the fair market value that is determined by local assessors to be the total taxable value of land and additions on the property. | Land | Improvement |
|---|---|---|---|---|
| 2025 | $15,416 | $1,557,200 | $833,800 | $723,400 |
| 2024 | $14,661 | $1,411,100 | $754,400 | $656,700 |
| 2023 | $13,446 | $1,287,900 | $714,700 | $573,200 |
| 2022 | $13,446 | $1,038,300 | $545,900 | $492,400 |
| 2021 | $12,028 | $911,900 | $466,500 | $445,400 |
| 2020 | $11,601 | $870,300 | $436,700 | $433,600 |
| 2019 | $11,330 | $846,800 | $436,700 | $410,100 |
| 2018 | $11,217 | $839,000 | $436,700 | $402,300 |
| 2017 | $11,112 | $809,900 | $436,700 | $373,200 |
| 2016 | $10,885 | $784,200 | $436,700 | $347,500 |
| 2015 | $11,375 | $855,900 | $516,200 | $339,700 |
| 2014 | $10,627 | $799,600 | $476,400 | $323,200 |
Source: Public Records
Map
Nearby Homes