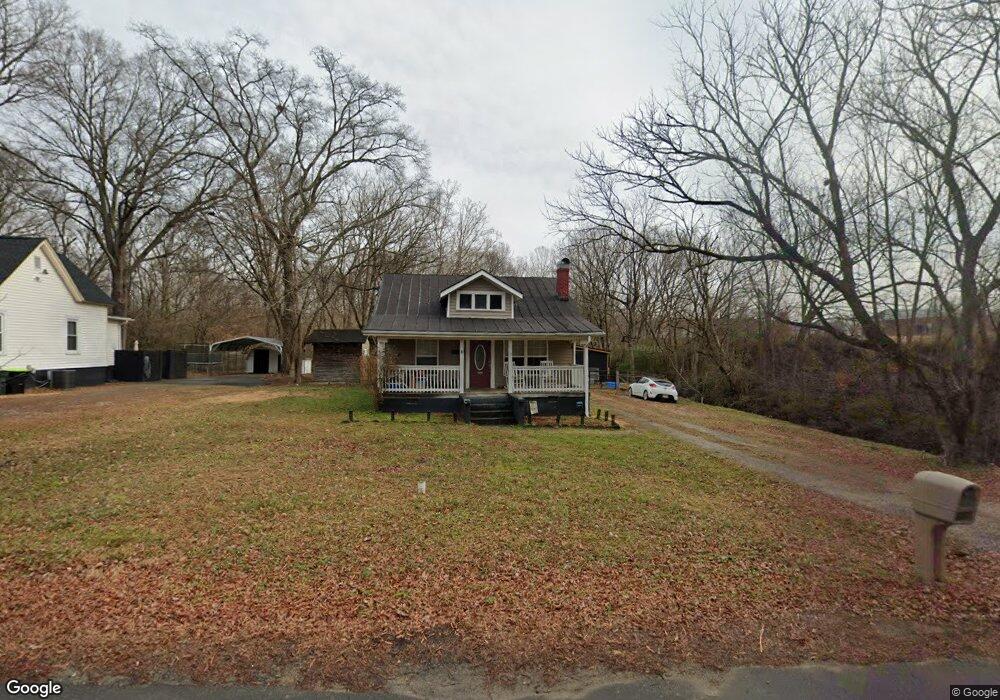
214 Coleman St Oxford, NC 27565
Estimated Value: $171,000 - $250,986
2
Beds
3
Baths
1,158
Sq Ft
$191/Sq Ft
Est. Value
About This Home
This home is located at 214 Coleman St, Oxford, NC 27565 and is currently estimated at $221,747, approximately $191 per square foot. 214 Coleman St is a home located in Granville County with nearby schools including West Oxford Elementary School, Northern Granville Middle School, and J.F. Webb High School.
Ownership History
Date
Name
Owned For
Owner Type
Purchase Details
Closed on
Apr 1, 2019
Sold by
Thompson Ducasse Wendy
Bought by
Ducasse Justin
Current Estimated Value
Purchase Details
Closed on
Jan 6, 2017
Sold by
Ward Michael G and Ward Ashley
Bought by
Ducasse Justin and Ducasse Wendy Thompson
Home Financials for this Owner
Home Financials are based on the most recent Mortgage that was taken out on this home.
Original Mortgage
$87,878
Outstanding Balance
$72,233
Interest Rate
4.03%
Mortgage Type
FHA
Estimated Equity
$149,514
Purchase Details
Closed on
Aug 12, 2011
Sold by
Ward Karen C
Bought by
Ward Michael G
Create a Home Valuation Report for This Property
The Home Valuation Report is an in-depth analysis detailing your home's value as well as a comparison with similar homes in the area
Home Values in the Area
Average Home Value in this Area
Purchase History
| Date | Buyer | Sale Price | Title Company |
|---|---|---|---|
| Ducasse Justin | -- | None Available | |
| Ducasse Justin | $90,000 | None Available | |
| Ward Michael G | -- | -- |
Source: Public Records
Mortgage History
| Date | Status | Borrower | Loan Amount |
|---|---|---|---|
| Open | Ducasse Justin | $87,878 | |
| Closed | Ducasse Justin | $2,636 |
Source: Public Records
Tax History Compared to Growth
Tax History
| Year | Tax Paid | Tax Assessment Tax Assessment Total Assessment is a certain percentage of the fair market value that is determined by local assessors to be the total taxable value of land and additions on the property. | Land | Improvement |
|---|---|---|---|---|
| 2025 | $2,227 | $189,067 | $43,750 | $145,317 |
| 2024 | $2,227 | $189,067 | $43,750 | $145,317 |
| 2023 | $1,407 | $92,632 | $21,875 | $70,757 |
| 2022 | $1,396 | $92,632 | $21,875 | $70,757 |
| 2021 | $1,391 | $92,632 | $21,875 | $70,757 |
| 2020 | $1,391 | $92,632 | $21,875 | $70,757 |
| 2019 | $1,391 | $92,632 | $21,875 | $70,757 |
| 2018 | $1,391 | $92,632 | $21,875 | $70,757 |
| 2016 | $1,027 | $66,224 | $21,875 | $44,349 |
| 2015 | $988 | $66,224 | $21,875 | $44,349 |
| 2014 | $988 | $66,224 | $21,875 | $44,349 |
| 2013 | -- | $66,224 | $21,875 | $44,349 |
Source: Public Records
Map
Nearby Homes