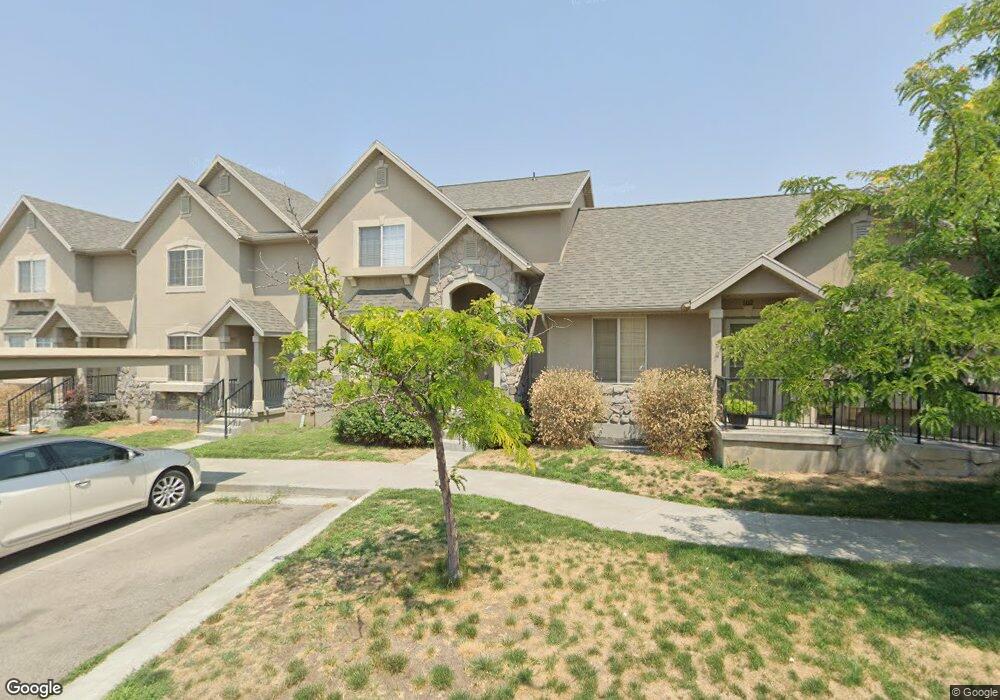
214 Crescent View Ln Unit 109 Tooele, UT 84074
Estimated Value: $308,000 - $339,000
3
Beds
2
Baths
2,096
Sq Ft
$154/Sq Ft
Est. Value
About This Home
This home is located at 214 Crescent View Ln Unit 109, Tooele, UT 84074 and is currently estimated at $323,087, approximately $154 per square foot. 214 Crescent View Ln Unit 109 is a home located in Tooele County with nearby schools including Copper Canyon Elementary School, Clarke N. Johnsen Junior High School, and Stansbury High School.
Ownership History
Date
Name
Owned For
Owner Type
Purchase Details
Closed on
Feb 7, 2023
Sold by
Jean Carol Beede Living Trust and Beede Craig Adam
Bought by
Saliba Jenny
Current Estimated Value
Home Financials for this Owner
Home Financials are based on the most recent Mortgage that was taken out on this home.
Original Mortgage
$286,200
Outstanding Balance
$277,365
Interest Rate
6.42%
Mortgage Type
New Conventional
Estimated Equity
$45,722
Purchase Details
Closed on
Nov 1, 2010
Sold by
Strum Gary
Bought by
Sonyador Llc
Create a Home Valuation Report for This Property
The Home Valuation Report is an in-depth analysis detailing your home's value as well as a comparison with similar homes in the area
Home Values in the Area
Average Home Value in this Area
Purchase History
| Date | Buyer | Sale Price | Title Company |
|---|---|---|---|
| Saliba Jenny | -- | Backman Title Services | |
| Sonyador Llc | -- | Charger Title |
Source: Public Records
Mortgage History
| Date | Status | Borrower | Loan Amount |
|---|---|---|---|
| Open | Saliba Jenny | $286,200 |
Source: Public Records
Tax History Compared to Growth
Tax History
| Year | Tax Paid | Tax Assessment Tax Assessment Total Assessment is a certain percentage of the fair market value that is determined by local assessors to be the total taxable value of land and additions on the property. | Land | Improvement |
|---|---|---|---|---|
| 2025 | $2,010 | $167,646 | $16,502 | $151,144 |
| 2024 | $2,806 | $164,827 | $55,000 | $109,827 |
| 2023 | $2,806 | $151,864 | $36,300 | $115,564 |
| 2022 | $1,522 | $130,923 | $41,250 | $89,673 |
| 2021 | $1,497 | $107,718 | $13,750 | $93,968 |
| 2020 | $178 | $178,919 | $25,000 | $153,919 |
| 2019 | $1,394 | $171,203 | $17,284 | $153,919 |
| 2018 | $1,050 | $143,135 | $20,000 | $123,135 |
| 2017 | $804 | $131,941 | $20,000 | $111,941 |
| 2016 | $854 | $69,636 | $11,000 | $58,636 |
| 2015 | $854 | $62,101 | $0 | $0 |
| 2014 | -- | $62,101 | $0 | $0 |
Source: Public Records
Map
Nearby Homes
- 223 Crescent View Ln Unit 126
- 234 W Crescent Ln Unit 99
- 23 W 1160 N Unit 14
- 231 W 1160 N Unit 13
- 231 W 1160 N Unit 16
- 231 W 1160 N Unit 15
- 241 W 1160 N Unit 17
- 241 W 1160 N Unit 19
- 241 W 1160 N Unit 18
- 251 W 1160 N Unit 23
- 251 W 1160 N Unit 22
- Red Sox Plan at Prosperity at Overlake - Priority Homes
- Cottonwood Plan at Prosperity at Overlake
- Phillies Plan at Prosperity at Overlake - Priority Homes
- Cubs Plan at Prosperity at Overlake - Priority Homes
- Willow Plan at Prosperity at Overlake
- Rangers Plan at Prosperity at Overlake - Priority Homes
- Pine Plan at Prosperity at Overlake
- Metropolitan Plan at Prosperity at Overlake - Priority Homes
- Aspen Plan at Prosperity at Overlake
- 214 Crescent View Ln Unit 108
- 214 Crescent View Ln Unit 107
- 214 Crescent View Ln
- 214 Crescent View Ln Unit 106
- 224 Crescent View Ln Unit 105
- 224 Crescent View Ln Unit 104
- 224 Crescent View Ln
- 224 Crescent View Ln Unit 102
- 224 Crescent View Ln Unit 123
- 204 Crescent View Ln Unit 113
- 204 Crescent View Ln Unit 112
- 204 Crescent View Ln Unit 111
- 204 Crescent View Ln Unit 110
- 223 Crescent View Ln
- 223 Crescent View Ln Unit 124
- 223 Crescent View Ln Unit 123
- 223 Crescent View Ln Unit 122
- 223 W Crescent Ln
- 223 Crescent View Ln Unit 125
- 223 W Crescent Ln Unit 130