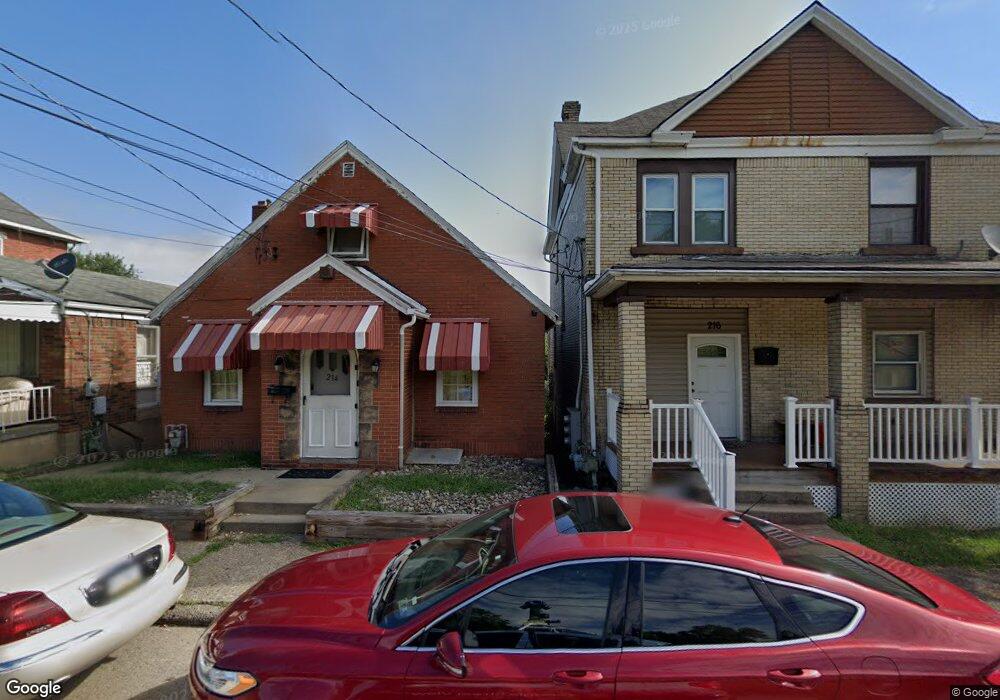
214 Crest St Clairton, PA 15025
Estimated Value: $56,508 - $80,000
3
Beds
2
Baths
864
Sq Ft
$83/Sq Ft
Est. Value
About This Home
This home is located at 214 Crest St, Clairton, PA 15025 and is currently estimated at $72,127, approximately $83 per square foot. 214 Crest St is a home located in Allegheny County with nearby schools including Clairton Elementary School, Clairton Middle School/High School, and Cornerstone Leadership Academy.
Ownership History
Date
Name
Owned For
Owner Type
Purchase Details
Closed on
Jan 23, 2024
Sold by
Mcgarry Lindsey E and Mcgarry Timothy
Bought by
Pittsburgh S F R Portfolio 2 A L L C
Current Estimated Value
Purchase Details
Closed on
Jan 17, 2024
Sold by
Mcgarry Timothy and Mcgarry Lindsey
Bought by
Pittsburgh Sfr Portfolio 2A Llc
Purchase Details
Closed on
Apr 7, 2021
Sold by
Splenda Trigg
Bought by
Mcgarry Timothy and Mcgarry Lindsey
Home Financials for this Owner
Home Financials are based on the most recent Mortgage that was taken out on this home.
Original Mortgage
$252,000
Interest Rate
3%
Mortgage Type
Purchase Money Mortgage
Purchase Details
Closed on
May 1, 2008
Sold by
Harper Ella M
Bought by
Splenda Trigg
Create a Home Valuation Report for This Property
The Home Valuation Report is an in-depth analysis detailing your home's value as well as a comparison with similar homes in the area
Home Values in the Area
Average Home Value in this Area
Purchase History
| Date | Buyer | Sale Price | Title Company |
|---|---|---|---|
| Pittsburgh Sfr Portfolio 2A Llc | $1,519,708 | -- | |
| Mcgarry Timothy | $315,000 | -- | |
| Splenda Trigg | -- | -- | |
| Mcgarry Timothy | $315,000 | Attorney | |
| Splenda Trigg | -- | None Available | |
| Splenda Trigg | $28,500 | -- | |
| Pittsburgh S F R Portfolio 2 A L L C | $430,234 | -- | |
| Pittsburgh S F R Portfolio 2 A L L C | $430,234 | -- | |
| Pittsburgh S F R Portfolio 2 A | $430,234 | -- |
Source: Public Records
Mortgage History
| Date | Status | Borrower | Loan Amount |
|---|---|---|---|
| Previous Owner | Mcgarry Timothy | $252,000 |
Source: Public Records
Tax History
| Year | Tax Paid | Tax Assessment Tax Assessment Total Assessment is a certain percentage of the fair market value that is determined by local assessors to be the total taxable value of land and additions on the property. | Land | Improvement |
|---|---|---|---|---|
| 2025 | $1,360 | $28,100 | $3,400 | $24,700 |
| 2024 | $1,360 | $28,100 | $3,400 | $24,700 |
| 2023 | $1,289 | $28,100 | $3,400 | $24,700 |
| 2022 | $1,289 | $28,100 | $3,400 | $24,700 |
| 2021 | $828 | $28,100 | $3,400 | $24,700 |
| 2020 | $1,280 | $28,100 | $3,400 | $24,700 |
| 2019 | $443 | $28,100 | $3,400 | $24,700 |
| 2017 | $435 | $28,100 | $3,400 | $24,700 |
Source: Public Records
Map
Nearby Homes
- 324 Crest St
- 412 5th St
- 627 Park Ave
- 624 Park Ave
- 635 Large Ave
- 550 Halcomb Ave
- 505 Wylie Ave
- 736 Large Ave
- 409 Mendelssohn Ave
- 737 Saint Clair Ave
- 856 Horton St
- 912 Waddell Ave
- 807 Toman Ave
- 850 Miller Ave
- 320 N 4th St
- 300 Locust Ave
- 500 Thompson Ave
- 864 Vankirk St
- 900 Vankirk St
- 520 Farnsworth Ave
Your Personal Tour Guide
Ask me questions while you tour the home.