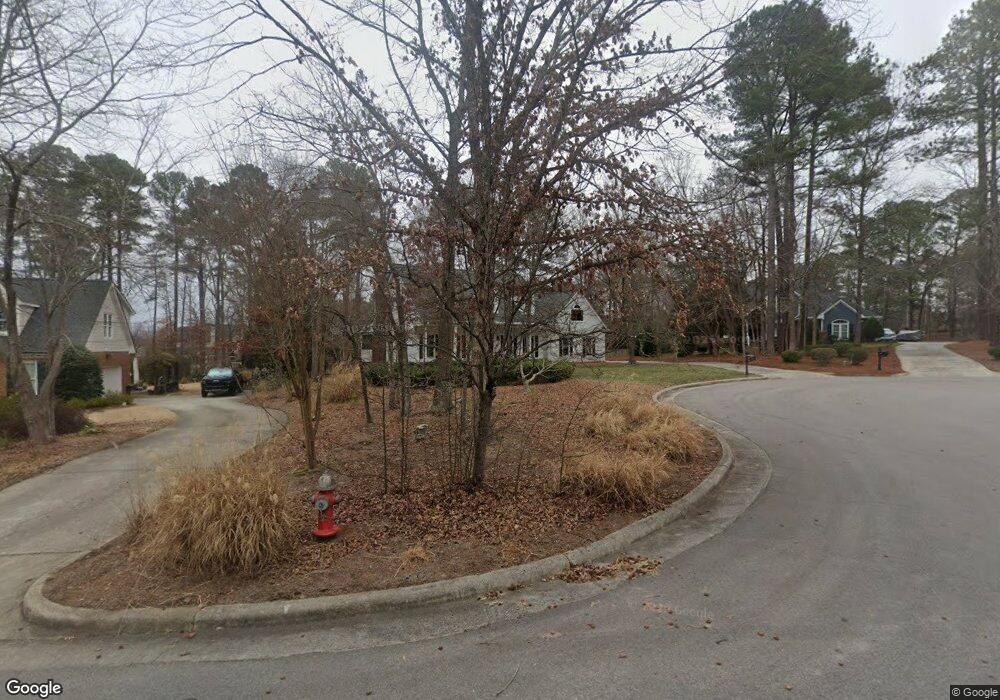
214 Draymore Way Cary, NC 27519
Preston NeighborhoodEstimated Value: $973,000 - $1,262,000
--
Bed
--
Bath
2,866
Sq Ft
$380/Sq Ft
Est. Value
About This Home
This home is located at 214 Draymore Way, Cary, NC 27519 and is currently estimated at $1,089,523, approximately $380 per square foot. 214 Draymore Way is a home located in Wake County with nearby schools including Green Hope Elementary, Davis Drive Middle, and Green Hope High.
Ownership History
Date
Name
Owned For
Owner Type
Purchase Details
Closed on
May 31, 1994
Bought by
Watson Jeffrey D and Watson Lorraine O
Current Estimated Value
Create a Home Valuation Report for This Property
The Home Valuation Report is an in-depth analysis detailing your home's value as well as a comparison with similar homes in the area
Home Values in the Area
Average Home Value in this Area
Purchase History
| Date | Buyer | Sale Price | Title Company |
|---|---|---|---|
| Watson Jeffrey D | $284,000 | -- |
Source: Public Records
Tax History Compared to Growth
Tax History
| Year | Tax Paid | Tax Assessment Tax Assessment Total Assessment is a certain percentage of the fair market value that is determined by local assessors to be the total taxable value of land and additions on the property. | Land | Improvement |
|---|---|---|---|---|
| 2025 | $7,917 | $921,358 | $325,000 | $596,358 |
| 2024 | $7,746 | $921,358 | $325,000 | $596,358 |
| 2023 | $6,169 | $613,674 | $183,000 | $430,674 |
| 2022 | $5,939 | $613,674 | $183,000 | $430,674 |
| 2021 | $5,819 | $613,674 | $183,000 | $430,674 |
| 2020 | $5,850 | $613,674 | $183,000 | $430,674 |
| 2019 | $5,631 | $524,024 | $168,000 | $356,024 |
| 2018 | $5,283 | $524,024 | $168,000 | $356,024 |
| 2017 | $5,077 | $524,024 | $168,000 | $356,024 |
| 2016 | $5,001 | $524,024 | $168,000 | $356,024 |
| 2015 | $5,022 | $508,039 | $152,000 | $356,039 |
| 2014 | -- | $508,039 | $152,000 | $356,039 |
Source: Public Records
Map
Nearby Homes
- 121 Goldenthal Ct
- 217 Preston Retreat Ln
- 107 Ackworth Ct
- 205 Benwell Ct
- 116 Dallavia Ct
- 104 Deerwalk Ct
- 112 Glen Abbey Dr
- 222 Murray Glen Dr
- 217 New Londondale Dr
- 114 Council Gap Ct
- 119 Ethans Glen Ct
- 113 Beeley Ct
- 107 Ethans Glen Ct
- 104 Ashmore Dr
- 107 Badin Lake Ct
- 408 Indian Elm Ln
- 106 Lake Tillery Dr
- 502 Quaker Dell Ln
- 102 Fentress Ct
- 218 Lake Brandt Dr
- 216 Draymore Way
- 212 Draymore Way
- 104 Vishay Ct
- 106 Vishay Ct
- 210 Draymore Way
- 218 Draymore Way
- 102 Vishay Ct
- 108 Vishay Ct
- 203 Hardenbrook Ct
- 207 Draymore Way
- 208 Draymore Way
- 100 Vishay Ct
- 209 Draymore Way
- 205 Hardenbrook Ct
- 205 Draymore Way
- 220 Draymore Way
- 107 Vishay Ct
- 105 Vishay Ct
- 103 Vishay Ct
- 206 Draymore Way