Estimated Value: $379,565 - $471,000
Studio
--
Bath
2,925
Sq Ft
$145/Sq Ft
Est. Value
About This Home
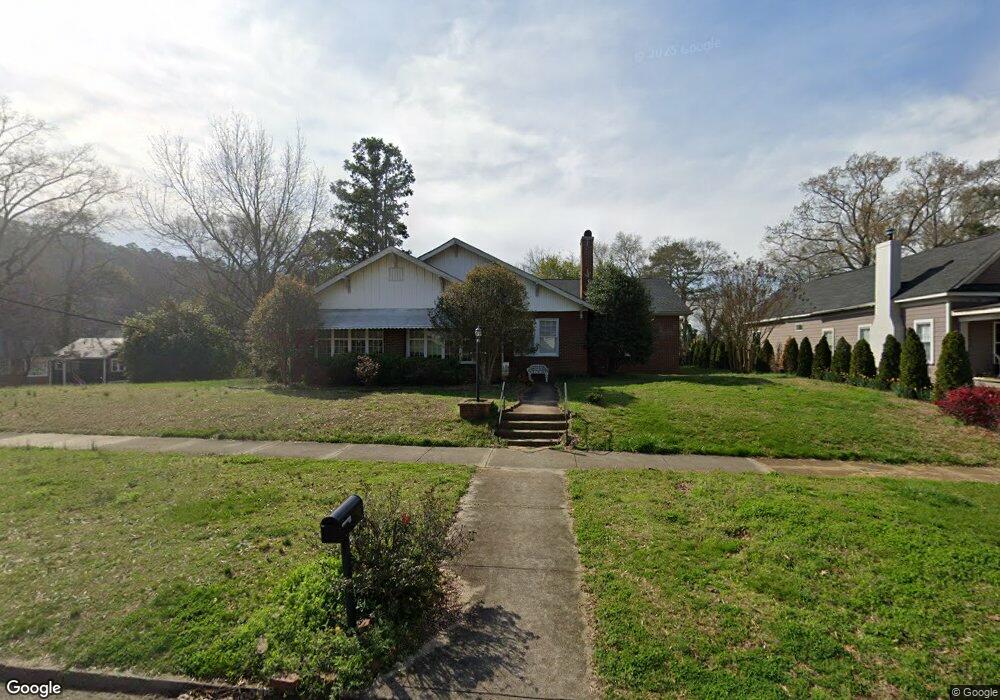
This home is located at 214 E 11th St SE, Rome, GA 30161 and is currently estimated at $425,141, approximately $145 per square foot. 214 E 11th St SE is a home located in Floyd County with nearby schools including Rome High School, St. Mary School, and Darlington School.
Ownership History
Date
Name
Owned For
Owner Type
Purchase Details
Closed on
Dec 6, 2001
Sold by
Vanleuven Mark W
Bought by
Vanleuven Mark W and Wendi Van Leuve
Current Estimated Value
Purchase Details
Closed on
Sep 30, 1999
Sold by
For Norma B Wadsworth
Bought by
Vanleuven Mark W
Purchase Details
Closed on
Sep 20, 1998
Sold by
Wadsworth King
Bought by
Leach Beth W As Trustee
Purchase Details
Closed on
Jul 20, 1998
Sold by
Leach Beth W As Trustee
Bought by
For Norma B Wadsworth
Purchase Details
Closed on
Jul 9, 1985
Sold by
Trust Company Bank Of Northwest Ga N A A
Bought by
Wadsworth King
Purchase Details
Closed on
Feb 28, 1975
Sold by
King Isobel B F N B Tr
Bought by
Trust Company Bank Of Northwest Ga N A A
Purchase Details
Closed on
Feb 23, 1972
Sold by
King J S F N B Trustee
Bought by
King Isobel B F N B Tr
Purchase Details
Closed on
Feb 22, 1972
Bought by
P and R
Purchase Details
Closed on
Mar 26, 1943
Bought by
King J S F N B Trustee
Create a Home Valuation Report for This Property
The Home Valuation Report is an in-depth analysis detailing your home's value as well as a comparison with similar homes in the area
Home Values in the Area
Average Home Value in this Area
Purchase History
| Date | Buyer | Sale Price | Title Company |
|---|---|---|---|
| Vanleuven Mark W | -- | -- | |
| Vanleuven Mark W | $110,500 | -- | |
| Leach Beth W As Trustee | -- | -- | |
| For Norma B Wadsworth | -- | -- | |
| Wadsworth King | -- | -- | |
| Trust Company Bank Of Northwest Ga N A A | -- | -- | |
| King Isobel B F N B Tr | -- | -- | |
| P | -- | -- | |
| King J S F N B Trustee | -- | -- |
Source: Public Records
Tax History
| Year | Tax Paid | Tax Assessment Tax Assessment Total Assessment is a certain percentage of the fair market value that is determined by local assessors to be the total taxable value of land and additions on the property. | Land | Improvement |
|---|---|---|---|---|
| 2025 | $3,927 | $168,205 | $21,722 | $146,483 |
| 2024 | $3,927 | $156,731 | $19,747 | $136,984 |
| 2023 | $3,904 | $146,458 | $17,952 | $128,506 |
| 2022 | $3,412 | $121,362 | $14,810 | $106,552 |
| 2021 | $3,282 | $110,892 | $14,810 | $96,082 |
| 2020 | $3,159 | $102,610 | $11,220 | $91,390 |
| 2019 | $3,048 | $97,760 | $11,220 | $86,540 |
| 2018 | $2,960 | $92,710 | $11,220 | $81,490 |
| 2017 | $2,864 | $87,185 | $11,220 | $75,965 |
| 2016 | $2,846 | $85,760 | $11,200 | $74,560 |
| 2015 | $2,691 | $84,955 | $11,200 | $73,755 |
| 2014 | $2,691 | $84,955 | $11,200 | $73,755 |
Source: Public Records
Map
Nearby Homes
- 307 E 11th St SE
- 415 E 10th St SE
- 416 E 9th St SE
- 0 Turnbull Dr SE Unit 10570009
- 4 Townview Rd SE
- 1 Vassar Dr SE
- 1314 E 2nd Ave SE
- 1407 E 2nd Ave SE
- 811 Collinwood Rd SE
- 12 Turnbull Dr SE
- 525 E 14th St SW
- 31 Notasulga Dr SW
- 209 Moultrie Ln SE
- 9 Richland Ct SE
- 9 Eastridge Ct SW
- 419 E 13th St SW
- 153 Vinings Ct SE
- 803/805 Maple Ave SW
- 803/80 Maple Ave SW
- 170 E 11th St SW
- 212 E 11th St SE
- 1100 Highland Ave SE
- 210 E 11th St SE
- 300 E 11th St SE
- 1102 Highland Ave SE
- 1103 Highland Ave SE
- 302 E 11th St SE
- 208 E 11th St SE
- 25 Eastwood Ln SE
- 30 Eastwood Ln SE
- 227 E 11th St SE
- 1104 Highland Ave SE
- 1122 Park Blvd SE
- 225 E 11th St SE
- 304 E 11th St SE
- 301 E 11th St SE
- 1120 Park Blvd SE
- 206 E 11th St SE
- 223 E 11th St SE
- 303 E 11th St SE
Your Personal Tour Guide
Ask me questions while you tour the home.