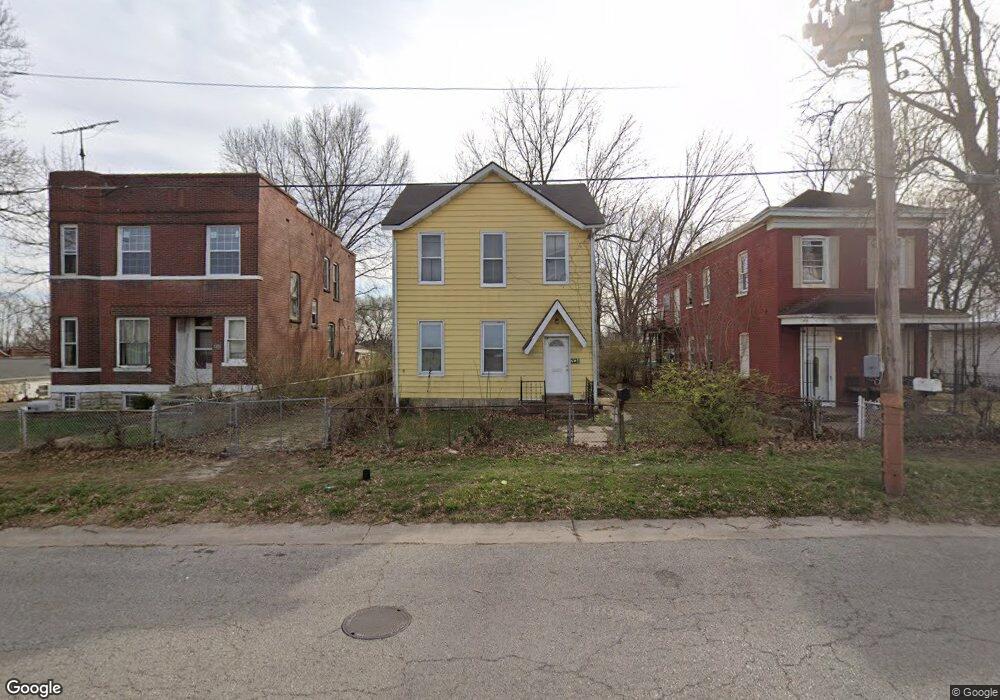
214 E Davis St Saint Louis, MO 63111
Patch NeighborhoodEstimated Value: $119,688 - $131,000
Studio
1
Bath
1,704
Sq Ft
$73/Sq Ft
Est. Value
About This Home
This home is located at 214 E Davis St, Saint Louis, MO 63111 and is currently estimated at $123,672, approximately $72 per square foot. 214 E Davis St is a home located in St. Louis City with nearby schools including Lyon at Blow Elementary School, Woerner Elementary School, and Roosevelt High School.
Ownership History
Date
Name
Owned For
Owner Type
Purchase Details
Closed on
Mar 18, 2015
Sold by
Right Price Realty Llc
Bought by
Vassali Kenneth Lee and Vassalli Bernadette
Current Estimated Value
Purchase Details
Closed on
Nov 19, 2014
Sold by
City Of St Louis
Bought by
Right Price Realty Llc
Purchase Details
Closed on
May 25, 2006
Sold by
Robinson Carey M and White John P
Bought by
Robinson Carey M
Purchase Details
Closed on
Sep 27, 2002
Sold by
Marolf Stewart and Marolf Linda C
Bought by
Robinson Carey M and White Johnathan P
Home Financials for this Owner
Home Financials are based on the most recent Mortgage that was taken out on this home.
Original Mortgage
$26,100
Interest Rate
5%
Mortgage Type
Purchase Money Mortgage
Purchase Details
Closed on
Jul 23, 2001
Sold by
Beneficial Mtg Co
Bought by
Marolf Stewart and Marolf Linda C
Purchase Details
Closed on
Jan 31, 2001
Sold by
Sutton Barbara R
Bought by
Beneficial Mtg Co Of Missouri Inc
Create a Home Valuation Report for This Property
The Home Valuation Report is an in-depth analysis detailing your home's value as well as a comparison with similar homes in the area
Home Values in the Area
Average Home Value in this Area
Purchase History
| Date | Buyer | Sale Price | Title Company |
|---|---|---|---|
| Vassali Kenneth Lee | $6,500 | None Available | |
| Right Price Realty Llc | $3,397 | None Available | |
| Robinson Carey M | -- | None Available | |
| Robinson Carey M | -- | -- | |
| Marolf Stewart | -- | -- | |
| Beneficial Mtg Co Of Missouri Inc | $14,014 | -- |
Source: Public Records
Mortgage History
| Date | Status | Borrower | Loan Amount |
|---|---|---|---|
| Previous Owner | Robinson Carey M | $26,100 |
Source: Public Records
Tax History
| Year | Tax Paid | Tax Assessment Tax Assessment Total Assessment is a certain percentage of the fair market value that is determined by local assessors to be the total taxable value of land and additions on the property. | Land | Improvement |
|---|---|---|---|---|
| 2025 | $549 | $10,350 | $1,140 | $9,210 |
| 2024 | $523 | $6,220 | $1,140 | $5,080 |
| 2023 | $523 | $6,220 | $1,140 | $5,080 |
| 2022 | $512 | $5,850 | $1,140 | $4,710 |
| 2021 | $511 | $5,850 | $1,140 | $4,710 |
| 2020 | $488 | $5,620 | $1,140 | $4,480 |
| 2019 | $487 | $5,620 | $1,140 | $4,480 |
| 2018 | $426 | $4,730 | $1,140 | $3,590 |
| 2017 | $419 | $4,730 | $1,140 | $3,590 |
| 2016 | $424 | $4,730 | $1,140 | $3,590 |
| 2015 | $387 | $4,730 | $1,140 | $3,590 |
| 2014 | $378 | $4,730 | $1,140 | $3,590 |
| 2013 | -- | $4,620 | $1,140 | $3,480 |
Source: Public Records
Map
Nearby Homes
- 8212 Pennsylvania Ave
- 8418 -20 S Broadway
- 7914 S Broadway
- 7915 S Broadway
- 8516 Pennsylvania Ave
- 122 W Courtois St
- 7820 Michigan Ave
- 7711 Minnesota Ave Unit 1
- 7721 Michigan Ave
- 7700 Michigan Ave
- 7725 Ivory Ave
- 7617 Ivory Ave
- 7326 Pennsylvania Ave
- 7310 Minnesota Ave
- 7501 Vermont Ave
- 235 Military Rd
- 7227 Pennsylvania Ave
- 7343 Virginia Ave
- 213 Waller Ave
- 252 Wachtel Ave
Your Personal Tour Guide
Ask me questions while you tour the home.