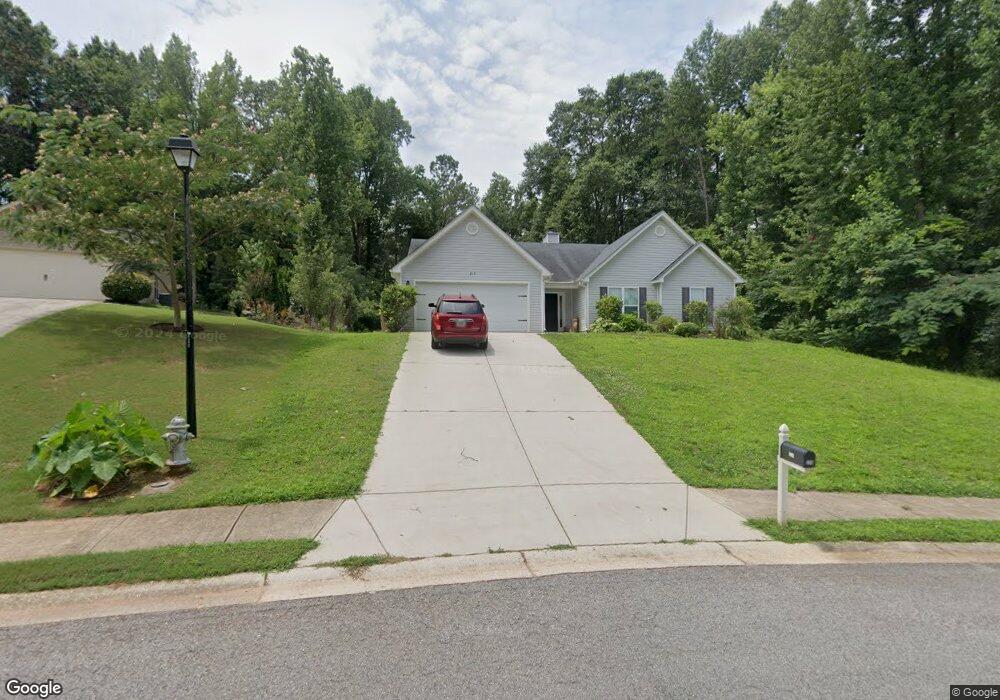
214 Falling Leaf Ln Unit 3 Winder, GA 30680
Estimated Value: $353,516 - $376,000
4
Beds
2
Baths
2,250
Sq Ft
$164/Sq Ft
Est. Value
About This Home
This home is located at 214 Falling Leaf Ln Unit 3, Winder, GA 30680 and is currently estimated at $369,629, approximately $164 per square foot. 214 Falling Leaf Ln Unit 3 is a home located in Barrow County with nearby schools including Holsenbeck Elementary School, Bear Creek Middle School, and Winder-Barrow High School.
Ownership History
Date
Name
Owned For
Owner Type
Purchase Details
Closed on
Mar 22, 2023
Sold by
Fkh Sfr C2 Lp
Bought by
Fkh Sfr M Lp
Current Estimated Value
Purchase Details
Closed on
Dec 11, 2020
Sold by
Bader Brian R
Bought by
Cerberus Sfr Holdings V Lp
Purchase Details
Closed on
Nov 7, 2014
Sold by
Southfork Homes Llc
Bought by
Bader Brian R and Sandlin Rachel Ina
Home Financials for this Owner
Home Financials are based on the most recent Mortgage that was taken out on this home.
Original Mortgage
$147,900
Interest Rate
4.16%
Mortgage Type
VA
Purchase Details
Closed on
Jun 2, 2014
Sold by
Embassy Development Llc
Bought by
Southfork Homes Llc
Purchase Details
Closed on
Jul 31, 2013
Sold by
Cooks Landing Llc
Bought by
Embassy Development Llc
Purchase Details
Closed on
Jun 30, 2005
Sold by
Rampey Daniel E And
Bought by
Cook'S Landing Llc
Create a Home Valuation Report for This Property
The Home Valuation Report is an in-depth analysis detailing your home's value as well as a comparison with similar homes in the area
Home Values in the Area
Average Home Value in this Area
Purchase History
| Date | Buyer | Sale Price | Title Company |
|---|---|---|---|
| Fkh Sfr M Lp | -- | -- | |
| Cerberus Sfr Holdings V Lp | $245,000 | -- | |
| Bader Brian R | $147,900 | -- | |
| Southfork Homes Llc | $210,000 | -- | |
| Embassy Development Llc | $245,000 | -- | |
| Cook'S Landing Llc | $419,900 | -- |
Source: Public Records
Mortgage History
| Date | Status | Borrower | Loan Amount |
|---|---|---|---|
| Previous Owner | Bader Brian R | $147,900 |
Source: Public Records
Tax History
| Year | Tax Paid | Tax Assessment Tax Assessment Total Assessment is a certain percentage of the fair market value that is determined by local assessors to be the total taxable value of land and additions on the property. | Land | Improvement |
|---|---|---|---|---|
| 2025 | $2,825 | $117,156 | $14,000 | $103,156 |
| 2024 | $2,918 | $113,994 | $14,000 | $99,994 |
| 2023 | $2,922 | $114,394 | $14,000 | $100,394 |
| 2022 | $2,668 | $89,652 | $14,000 | $75,652 |
| 2021 | $2,737 | $86,865 | $14,000 | $72,865 |
| 2020 | $147 | $70,142 | $14,000 | $56,142 |
| 2019 | $147 | $77,238 | $16,000 | $61,238 |
| 2018 | $2,146 | $70,142 | $14,000 | $56,142 |
| 2017 | $1,715 | $58,892 | $14,000 | $44,892 |
| 2016 | $1,778 | $59,346 | $14,000 | $45,346 |
| 2015 | $1,700 | $59,346 | $14,000 | $45,346 |
| 2014 | $86 | $2,800 | $2,800 | $0 |
| 2013 | -- | $2,800 | $2,800 | $0 |
Source: Public Records
Map
Nearby Homes
- 505 Stoney Creek Dr
- 508 Pleasant Hill Church Rd NE
- 1553 Shoal Creek Dr
- 369 Kay Dr
- 104 Candler Park Dr
- 614 Anns Way
- 908 Justin Dr
- 917 Justin Dr Unit 3
- 973 Vera Ct
- 1264 Highway 211 NE
- 432 Raymond Dr
- 715 Summerfield Rd
- 162 Delightful Way Unit 28
- 230 Delightful Way Unit 23
- 281 Delightful Way Unit 7
- 824 Eastmont Rd
- 246 Pleasant Hill Church Rd NE
- 1015 Jefferson Hwy
- 16 Fox Dr
- 83 Beech Creek Cir
- 214 Falling Leaf Ln
- 212 Falling Leaf Ln Unit 2
- 212 Falling Leaf Ln
- 216 Falling Leaf Ln Unit 4
- 210 Falling Leaf Ln
- 210 Falling Leaf Ln Unit 1
- 218 Falling Leaf Ln
- 218 Falling Leaf Ln Unit 5
- 223 Falling Leaf Ln Unit 32
- 223 Falling Leaf Ln
- 926 Cook Rd
- 220 Falling Leaf Ln Unit 6
- 220 Falling Leaf Ln
- 209 Falling Leaf Ln Unit 34
- 209 Falling Leaf Ln
- 225 Falling Leaf Ln Unit 31
- 225 Falling Leaf Ln
- 928 Cook Rd
- 224 Falling Leaf Ln
- 224 Falling Leaf Ln Unit 7
Your Personal Tour Guide
Ask me questions while you tour the home.