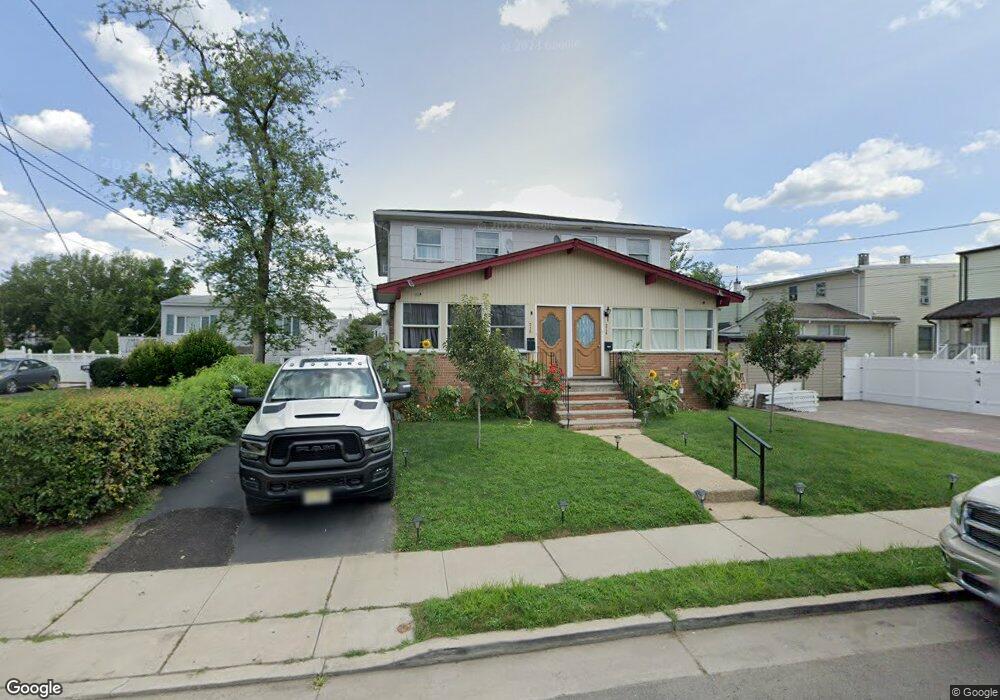
214 Hardy Ave Unit 216 Bound Brook, NJ 08805
Estimated Value: $602,000 - $627,868
--
Bed
--
Bath
2,792
Sq Ft
$219/Sq Ft
Est. Value
About This Home
This home is located at 214 Hardy Ave Unit 216, Bound Brook, NJ 08805 and is currently estimated at $612,217, approximately $219 per square foot. 214 Hardy Ave Unit 216 is a home located in Somerset County with nearby schools including LaMonte Annex Elementary School, Lafayette Elementary School, and Bound Brook High School.
Ownership History
Date
Name
Owned For
Owner Type
Purchase Details
Closed on
Feb 16, 2017
Sold by
Alvia Pascual
Bought by
Leita Dinis and Leita Marta Lidia
Current Estimated Value
Home Financials for this Owner
Home Financials are based on the most recent Mortgage that was taken out on this home.
Original Mortgage
$112,000
Outstanding Balance
$92,705
Interest Rate
4.19%
Mortgage Type
New Conventional
Estimated Equity
$519,512
Purchase Details
Closed on
Sep 7, 2001
Sold by
Shore Construction
Bought by
Pascual Alvia
Home Financials for this Owner
Home Financials are based on the most recent Mortgage that was taken out on this home.
Original Mortgage
$150,000
Interest Rate
6.99%
Purchase Details
Closed on
Jun 7, 2001
Sold by
Fairbanks Capital
Bought by
Shore Construction
Purchase Details
Closed on
Apr 28, 1989
Sold by
Abenante Lorraine M and Abenante Virginia
Bought by
Barnosky Alexander S and Barnosky Judith
Create a Home Valuation Report for This Property
The Home Valuation Report is an in-depth analysis detailing your home's value as well as a comparison with similar homes in the area
Home Values in the Area
Average Home Value in this Area
Purchase History
| Date | Buyer | Sale Price | Title Company |
|---|---|---|---|
| Leita Dinis | $275,000 | Guardian Title Services Llc | |
| Pascual Alvia | $210,000 | -- | |
| Shore Construction | $143,000 | -- | |
| Shore Construction | $143,000 | -- | |
| Barnosky Alexander S | $250,000 | -- |
Source: Public Records
Mortgage History
| Date | Status | Borrower | Loan Amount |
|---|---|---|---|
| Open | Leita Dinis | $112,000 | |
| Previous Owner | Pascual Alvia | $150,000 |
Source: Public Records
Tax History Compared to Growth
Tax History
| Year | Tax Paid | Tax Assessment Tax Assessment Total Assessment is a certain percentage of the fair market value that is determined by local assessors to be the total taxable value of land and additions on the property. | Land | Improvement |
|---|---|---|---|---|
| 2025 | $10,785 | $498,600 | $175,600 | $323,000 |
| 2024 | $10,785 | $475,300 | $155,600 | $319,700 |
| 2023 | $10,441 | $442,800 | $130,600 | $312,200 |
| 2022 | $10,149 | $407,900 | $105,600 | $302,300 |
| 2021 | $10,436 | $383,800 | $75,600 | $308,200 |
| 2020 | $10,450 | $338,500 | $55,600 | $282,900 |
| 2019 | $10,436 | $322,400 | $35,600 | $286,800 |
| 2018 | $7,638 | $229,100 | $35,600 | $193,500 |
| 2017 | $7,719 | $226,300 | $35,600 | $190,700 |
| 2016 | $8,628 | $254,800 | $15,600 | $239,200 |
| 2015 | $9,539 | $288,100 | $15,600 | $272,500 |
| 2014 | $9,876 | $288,100 | $15,600 | $272,500 |
Source: Public Records
Map
Nearby Homes
- 105 La Monte Ave
- 432 Talmage Ave
- 542 Wheatland Ave
- 512 W 2nd St
- 510 Dalay Place
- 40 van Keuren Ave Unit 42
- 34 van Keuren Ave Unit 38
- 130 W High St Unit 132
- 126 W High St
- 307 W Union Ave
- 102 W Franklin St
- 2 Drake St
- 208 Sanders Ave
- 601 Thompson Ave
- 606 Vosseller Ave
- 320 Church St
- 641 Crescent Dr
- 617 Vosseller Ave
- 520 Winsor St
- 112-114 E Union Ave
- 214-216 Hardy Ave
- 218 Hardy Ave
- 415 Wheatland Ave
- 407 Wheatland Ave
- 419 Wheatland Ave Unit 2
- 419 Wheatland Ave
- 137 La Monte Ave
- 415 W 2nd St
- 135 La Monte Ave
- 411 W 2nd St
- 139 La Monte Ave
- 131 La Monte Ave
- 131 La Monte Ave Unit 2
- 131 La Monte Ave Unit 1
- 143 La Monte Ave
- 507 Wheatland Ave
- 507 Wheatland Ave Unit A
- 507 Wheatland Ave Unit B
- 145 La Monte Ave
- 215 Hardy Ave