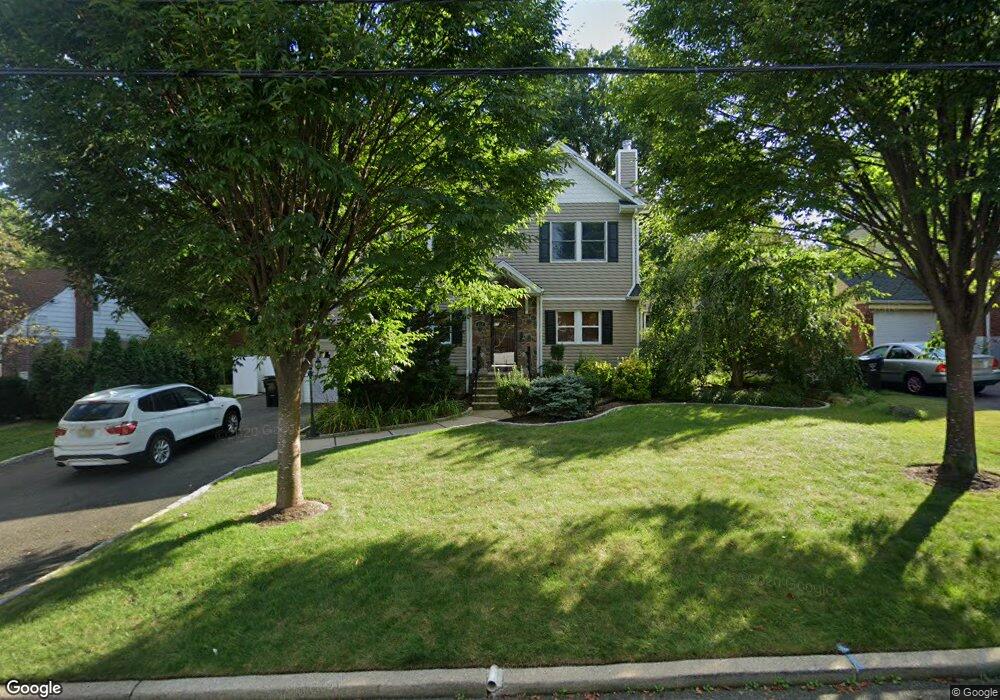
214 Lentz Ave Paramus, NJ 07652
Estimated Value: $981,419 - $1,219,000
--
Bed
--
Bath
2,070
Sq Ft
$531/Sq Ft
Est. Value
About This Home
This home is located at 214 Lentz Ave, Paramus, NJ 07652 and is currently estimated at $1,099,605, approximately $531 per square foot. 214 Lentz Ave is a home located in Bergen County with nearby schools including Paramus High School, Visitation Academy, and David Gregory School.
Ownership History
Date
Name
Owned For
Owner Type
Purchase Details
Closed on
May 16, 2016
Sold by
Ditomassi Mark
Bought by
Fish Edward and Fish Renata
Current Estimated Value
Home Financials for this Owner
Home Financials are based on the most recent Mortgage that was taken out on this home.
Original Mortgage
$528,000
Outstanding Balance
$419,363
Interest Rate
3.59%
Mortgage Type
New Conventional
Estimated Equity
$680,242
Purchase Details
Closed on
Apr 18, 2008
Sold by
Katz Robert W and Katz Melissa L
Bought by
Ditomassi Mark
Home Financials for this Owner
Home Financials are based on the most recent Mortgage that was taken out on this home.
Original Mortgage
$217,500
Interest Rate
5.93%
Mortgage Type
Credit Line Revolving
Purchase Details
Closed on
Nov 12, 2003
Sold by
Woods Cyril
Bought by
Katz Robert and Katz Melissa
Home Financials for this Owner
Home Financials are based on the most recent Mortgage that was taken out on this home.
Original Mortgage
$30,800
Interest Rate
5.98%
Create a Home Valuation Report for This Property
The Home Valuation Report is an in-depth analysis detailing your home's value as well as a comparison with similar homes in the area
Home Values in the Area
Average Home Value in this Area
Purchase History
| Date | Buyer | Sale Price | Title Company |
|---|---|---|---|
| Fish Edward | $660,000 | Attorney | |
| Ditomassi Mark | $705,000 | -- | |
| Katz Robert | $385,000 | -- |
Source: Public Records
Mortgage History
| Date | Status | Borrower | Loan Amount |
|---|---|---|---|
| Open | Fish Edward | $528,000 | |
| Previous Owner | Ditomassi Mark | $217,500 | |
| Previous Owner | Katz Robert | $30,800 |
Source: Public Records
Tax History Compared to Growth
Tax History
| Year | Tax Paid | Tax Assessment Tax Assessment Total Assessment is a certain percentage of the fair market value that is determined by local assessors to be the total taxable value of land and additions on the property. | Land | Improvement |
|---|---|---|---|---|
| 2025 | $11,528 | $1,071,500 | $387,000 | $684,500 |
| 2024 | $9,830 | $761,400 | $350,500 | $410,900 |
| 2023 | $9,324 | $640,800 | $335,900 | $304,900 |
| 2022 | $9,324 | $600,800 | $315,200 | $285,600 |
| 2021 | $9,008 | $544,600 | $283,000 | $261,600 |
| 2020 | $8,528 | $534,700 | $278,000 | $256,700 |
| 2019 | $8,812 | $474,800 | $275,000 | $199,800 |
| 2018 | $8,703 | $474,800 | $275,000 | $199,800 |
| 2017 | $8,551 | $474,800 | $275,000 | $199,800 |
| 2016 | $8,319 | $474,800 | $275,000 | $199,800 |
| 2015 | $8,233 | $474,800 | $275,000 | $199,800 |
| 2014 | $8,162 | $474,800 | $275,000 | $199,800 |
Source: Public Records
Map
Nearby Homes
- 362 Harrison St
- 333 Harrison St
- 224 Concord Dr
- 415 Bailey Rd
- 391 Harrison St
- 23 Halco Dr
- 216 E Midland Ave
- 366 Spring Valley Rd
- 390 Spring Valley Rd
- 156 Stuart St
- 308 Haywood Dr
- 331 Ellen Place
- 327 E Midland Ave
- 817 Riverdell Rd
- 165 Hebberd Ave
- 275 Wedgewood Dr
- 766 7th Ave
- 517 Marion Ln
- 374 E Midland Ave
- 517 Fordham Place