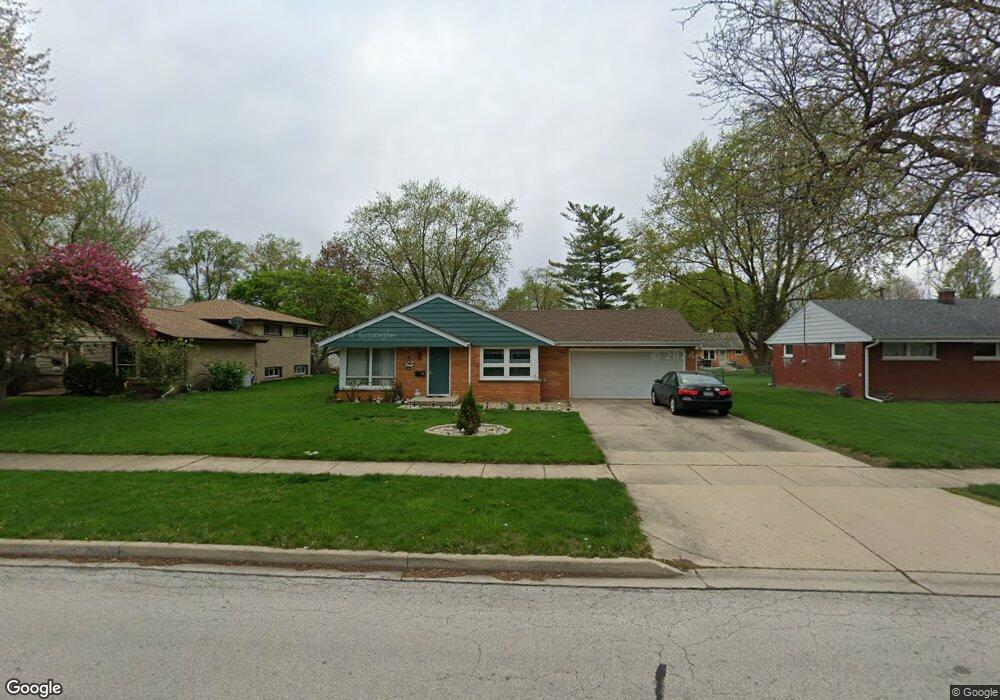
214 Lilac Ln Unit 1 North Aurora, IL 60542
Estimated Value: $297,000 - $324,000
3
Beds
2
Baths
1,305
Sq Ft
$238/Sq Ft
Est. Value
About This Home
This home is located at 214 Lilac Ln Unit 1, North Aurora, IL 60542 and is currently estimated at $310,019, approximately $237 per square foot. 214 Lilac Ln Unit 1 is a home located in Kane County with nearby schools including Schneider Elementary School, Herget Middle School, and West Aurora High School.
Ownership History
Date
Name
Owned For
Owner Type
Purchase Details
Closed on
Aug 18, 2017
Sold by
Rollins Kevin and Rollins Emily A
Bought by
Moreno Fabiola
Current Estimated Value
Home Financials for this Owner
Home Financials are based on the most recent Mortgage that was taken out on this home.
Original Mortgage
$156,186
Outstanding Balance
$131,740
Interest Rate
4.37%
Mortgage Type
FHA
Estimated Equity
$178,279
Purchase Details
Closed on
Jun 5, 2015
Sold by
Jones Emily A
Bought by
Rollins Kevin and Rollins Emily A
Home Financials for this Owner
Home Financials are based on the most recent Mortgage that was taken out on this home.
Original Mortgage
$118,500
Interest Rate
4.37%
Mortgage Type
New Conventional
Purchase Details
Closed on
Jul 14, 2011
Sold by
Weis Arthur M and Weis Florence M
Bought by
Jones Emily A
Home Financials for this Owner
Home Financials are based on the most recent Mortgage that was taken out on this home.
Original Mortgage
$116,470
Interest Rate
4.87%
Mortgage Type
FHA
Create a Home Valuation Report for This Property
The Home Valuation Report is an in-depth analysis detailing your home's value as well as a comparison with similar homes in the area
Home Values in the Area
Average Home Value in this Area
Purchase History
| Date | Buyer | Sale Price | Title Company |
|---|---|---|---|
| Moreno Fabiola | $178,500 | First American Title | |
| Rollins Kevin | -- | None Available | |
| Jones Emily A | $119,500 | Fox Title Company |
Source: Public Records
Mortgage History
| Date | Status | Borrower | Loan Amount |
|---|---|---|---|
| Open | Moreno Fabiola | $156,186 | |
| Previous Owner | Rollins Kevin | $118,500 | |
| Previous Owner | Jones Emily A | $116,470 |
Source: Public Records
Tax History Compared to Growth
Tax History
| Year | Tax Paid | Tax Assessment Tax Assessment Total Assessment is a certain percentage of the fair market value that is determined by local assessors to be the total taxable value of land and additions on the property. | Land | Improvement |
|---|---|---|---|---|
| 2024 | $5,700 | $83,833 | $11,127 | $72,706 |
| 2023 | $5,540 | $76,087 | $10,099 | $65,988 |
| 2022 | $5,047 | $67,074 | $9,438 | $57,636 |
| 2021 | $4,898 | $63,613 | $8,951 | $54,662 |
| 2020 | $4,878 | $62,390 | $8,779 | $53,611 |
| 2019 | $4,925 | $60,181 | $8,468 | $51,713 |
| 2018 | $4,877 | $57,888 | $8,145 | $49,743 |
| 2017 | $3,708 | $44,318 | $7,876 | $36,442 |
| 2016 | $3,692 | $43,028 | $7,647 | $35,381 |
| 2015 | -- | $42,048 | $7,473 | $34,575 |
| 2014 | -- | $47,104 | $7,238 | $39,866 |
| 2013 | -- | $48,550 | $9,462 | $39,088 |
Source: Public Records
Map
Nearby Homes
- 203 Lilac Ln
- 202 Linn Ct Unit C
- 215 Dee Rd
- 114 Briar Ln Unit 2
- 302 Dee Rd
- 105 April Ln Unit 2
- 122 E State St
- 254 Ridge Rd
- 925 Darwin St
- 148 N Lincolnway
- 24 S Grant St
- 273 Ridley St
- 12 N Lincolnway
- 218 Timber Oaks Dr
- 719 Pinecreek Dr
- 16 S Grace St
- 355 Hilltop Dr
- 616 Pinehurst Dr
- 344 Hilltop Dr
- 306 Harmony Dr