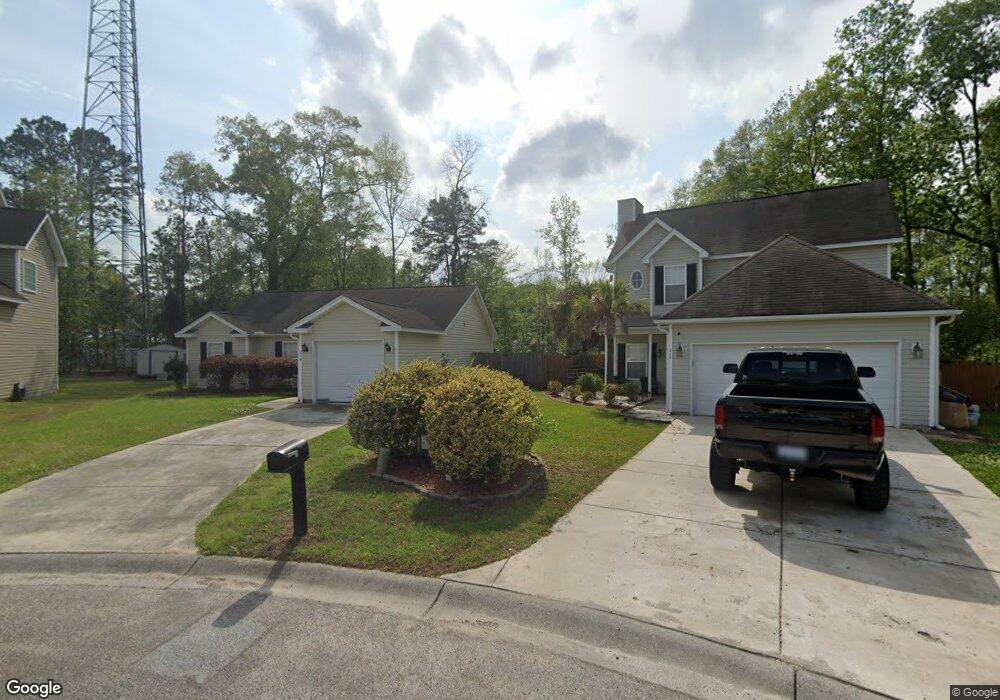
214 Maplewood Ridge Ct Summerville, SC 29483
Estimated Value: $251,000 - $288,000
3
Beds
2
Baths
1,156
Sq Ft
$233/Sq Ft
Est. Value
About This Home
This home is located at 214 Maplewood Ridge Ct, Summerville, SC 29483 and is currently estimated at $269,300, approximately $232 per square foot. 214 Maplewood Ridge Ct is a home located in Berkeley County with nearby schools including Sangaree Elementary School, Sangaree Intermediate School, and Sangaree Middle School.
Ownership History
Date
Name
Owned For
Owner Type
Purchase Details
Closed on
Oct 11, 2013
Sold by
Bassi Eric M
Bought by
Robinson Ashlei
Current Estimated Value
Home Financials for this Owner
Home Financials are based on the most recent Mortgage that was taken out on this home.
Original Mortgage
$122,735
Outstanding Balance
$92,476
Interest Rate
4.57%
Mortgage Type
FHA
Estimated Equity
$176,824
Purchase Details
Closed on
Apr 27, 2007
Sold by
Jessco Homes Inc
Bought by
Bassi Eric M
Home Financials for this Owner
Home Financials are based on the most recent Mortgage that was taken out on this home.
Original Mortgage
$121,581
Interest Rate
6.11%
Mortgage Type
FHA
Purchase Details
Closed on
Nov 10, 2006
Sold by
S & J Acquisitions Llc
Bought by
Jessco Inc
Create a Home Valuation Report for This Property
The Home Valuation Report is an in-depth analysis detailing your home's value as well as a comparison with similar homes in the area
Home Values in the Area
Average Home Value in this Area
Purchase History
| Date | Buyer | Sale Price | Title Company |
|---|---|---|---|
| Robinson Ashlei | $125,000 | -- | |
| Bassi Eric M | $123,490 | None Available | |
| Jessco Homes Inc | -- | None Available | |
| Jessco Inc | $448,000 | None Available |
Source: Public Records
Mortgage History
| Date | Status | Borrower | Loan Amount |
|---|---|---|---|
| Open | Robinson Ashlei | $122,735 | |
| Previous Owner | Jessco Homes Inc | $121,581 |
Source: Public Records
Tax History Compared to Growth
Tax History
| Year | Tax Paid | Tax Assessment Tax Assessment Total Assessment is a certain percentage of the fair market value that is determined by local assessors to be the total taxable value of land and additions on the property. | Land | Improvement |
|---|---|---|---|---|
| 2025 | $729 | $149,040 | $31,050 | $117,990 |
| 2024 | $691 | $5,962 | $1,242 | $4,720 |
| 2023 | $691 | $5,962 | $1,242 | $4,720 |
| 2022 | $692 | $5,184 | $1,000 | $4,184 |
| 2021 | $709 | $5,180 | $1,000 | $4,184 |
| 2020 | $717 | $5,184 | $1,000 | $4,184 |
| 2019 | $712 | $5,184 | $1,000 | $4,184 |
| 2018 | $660 | $4,532 | $1,000 | $3,532 |
| 2017 | $661 | $4,532 | $1,000 | $3,532 |
| 2016 | $675 | $4,530 | $1,000 | $3,530 |
| 2015 | $628 | $4,530 | $1,000 | $3,530 |
| 2014 | $618 | $4,530 | $1,000 | $3,530 |
| 2013 | -- | $4,530 | $1,000 | $3,530 |
Source: Public Records
Map
Nearby Homes
- 100 Photinia Ct
- 109 Wisteria Ct
- 100 Trescott Ct
- 414 Courtland Dr
- 482 Courtland Dr
- 154 Fern Ct
- 114 Tennyson Way
- 137 Paddock Way
- 104 Hialeah Ct
- 106 Hialeah Ct
- 150 Highland Ave
- 81 Red Bluff St
- 86 Red Bluff St
- 120 Eaton Way
- 103 Coventry Rd
- 306 Sundial Ln
- 121 Heather Dr
- 107 Broken Trail
- 107 Tabby Creek Cir
- 437 Cadbury Loop
- 215 Maplewood Ridge Ct
- 212 Maplewood Ridge Ct
- 210 Maplewood Ridge Ct
- 213 Maplewood Ridge Ct
- 0 Royle Road 233
- 211 Maplewood Ridge Ct
- 208 Maplewood Ridge Ct
- 209 Maplewood Ridge Ct
- 207 Maplewood Ridge Ct
- 206 Maplewood Ridge Ct
- 205 Maplewood Ridge Ct
- 204 Maplewood Ridge Ct
- 201 Maplewood Ridge Ct
- 1259 Royle Rd
- 202 Maplewood Ridge Ct
- 104 Courtland Dr
- 114 Hedge Way
- 112 Hedge Way
- 116 Hedge Way
- 1260 Royle Rd