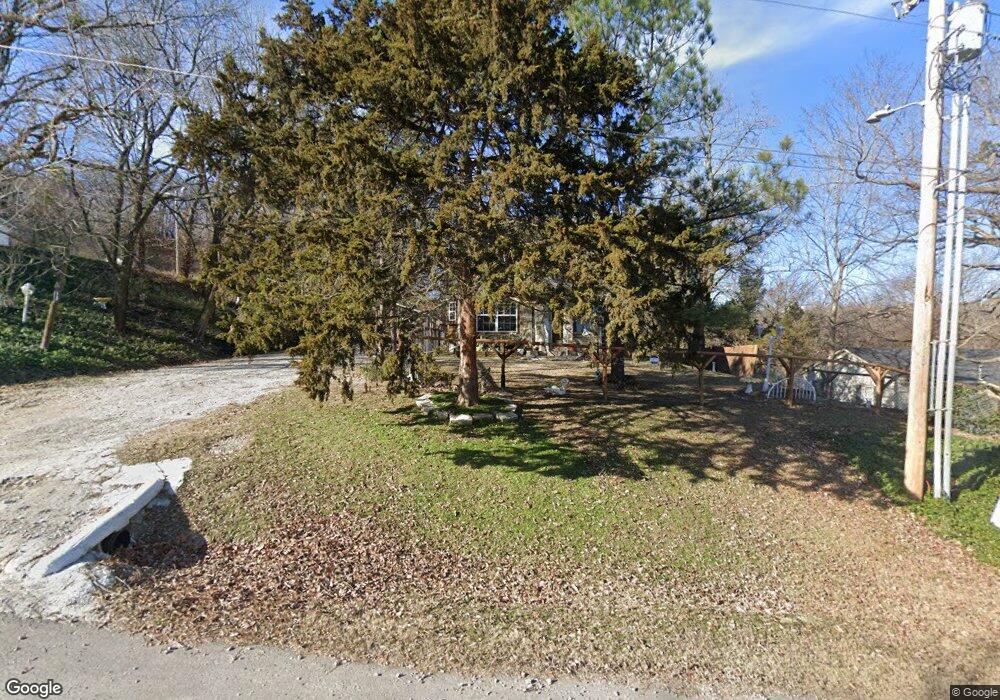
214 N 2nd Kiefer, OK 74041
Estimated Value: $136,141 - $230,000
2
Beds
1
Bath
826
Sq Ft
$197/Sq Ft
Est. Value
About This Home
This home is located at 214 N 2nd, Kiefer, OK 74041 and is currently estimated at $163,035, approximately $197 per square foot. 214 N 2nd is a home located in Creek County with nearby schools including Kiefer Elementary School, Rongey Middle School, and Kiefer High School.
Ownership History
Date
Name
Owned For
Owner Type
Purchase Details
Closed on
Jan 19, 2007
Sold by
Thomas Donna J and Thomas Danny Lee
Bought by
Moody Steve and Moody Cheryl
Current Estimated Value
Purchase Details
Closed on
Apr 4, 2006
Sold by
Whitchurch Eddie and Whitchurch Eva Renee
Bought by
Moody Steve and Moody Cheryl
Create a Home Valuation Report for This Property
The Home Valuation Report is an in-depth analysis detailing your home's value as well as a comparison with similar homes in the area
Home Values in the Area
Average Home Value in this Area
Purchase History
| Date | Buyer | Sale Price | Title Company |
|---|---|---|---|
| Moody Steve | -- | American Abstract Abd Title | |
| Moody Steve | $8,000 | None Available |
Source: Public Records
Tax History Compared to Growth
Tax History
| Year | Tax Paid | Tax Assessment Tax Assessment Total Assessment is a certain percentage of the fair market value that is determined by local assessors to be the total taxable value of land and additions on the property. | Land | Improvement |
|---|---|---|---|---|
| 2025 | $697 | $7,812 | $1,628 | $6,184 |
| 2024 | $689 | $7,629 | $952 | $6,677 |
| 2023 | $689 | $7,629 | $1,028 | $6,601 |
| 2022 | $665 | $7,628 | $1,053 | $6,575 |
| 2021 | $713 | $7,629 | $1,274 | $6,355 |
| 2020 | $694 | $7,628 | $1,362 | $6,266 |
| 2019 | $684 | $7,628 | $1,319 | $6,309 |
| 2018 | $682 | $7,629 | $2,073 | $5,556 |
| 2017 | $659 | $7,628 | $2,130 | $5,498 |
| 2016 | $641 | $7,407 | $2,078 | $5,329 |
| 2015 | -- | $7,191 | $2,027 | $5,164 |
| 2014 | -- | $6,981 | $1,977 | $5,004 |
Source: Public Records
Map
Nearby Homes
- 341 N Main St
- 311 E Indiana
- 33 Mary
- 8 Ryan Place
- 112 Stark St
- 6490 Lindsay Dr
- 8850 W 151st St S
- 8801 S Ridgeview Dr
- 13435 S Garrett St
- 15116 S 90th West Ave
- 134 Dp Newman Cir
- 6355 Rockwood Cir N
- 129 Dp Newman Cir
- 205 Vail Cir
- 205 Taos Dr
- 13623 S 97th Ave W
- 16042 S 97th West Ave
- 15002 S Justin Ave
- 10616 W Houston St
- 803 W 150th St