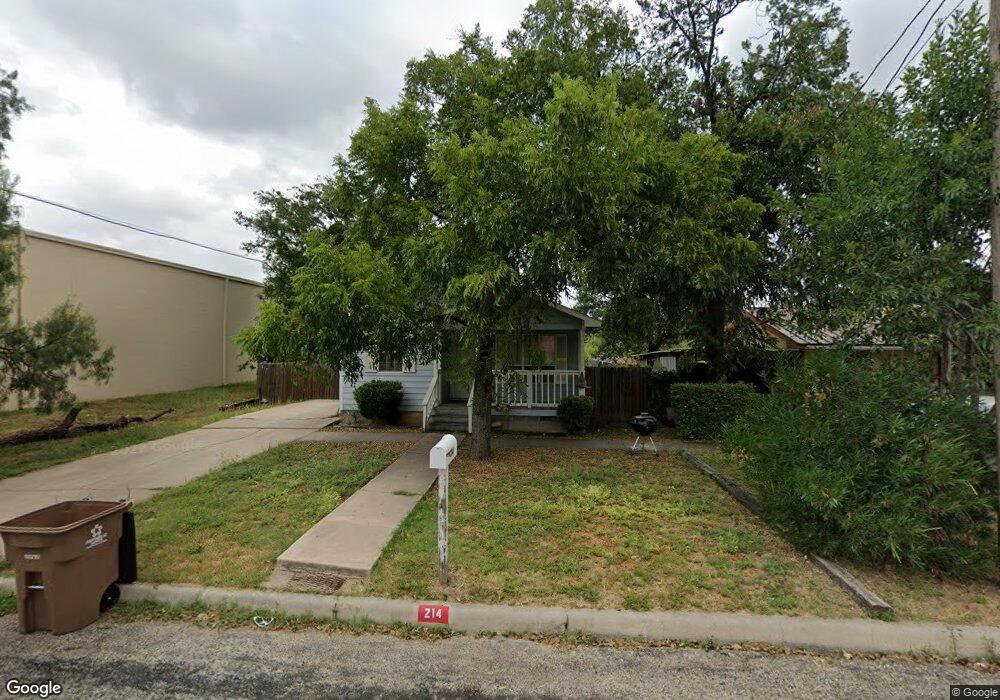
214 N Baze St San Angelo, TX 76903
Fort Concho East NeighborhoodEstimated Value: $52,000 - $159,000
--
Bed
--
Bath
1,072
Sq Ft
$94/Sq Ft
Est. Value
About This Home
This home is located at 214 N Baze St, San Angelo, TX 76903 and is currently estimated at $100,520, approximately $93 per square foot. 214 N Baze St is a home located in Tom Green County with nearby schools including San Jacinto Elementary School, Lone Star Middle School, and Central High School.
Ownership History
Date
Name
Owned For
Owner Type
Purchase Details
Closed on
Sep 10, 2020
Sold by
Correa Christina Fisher and Fisher Christina
Bought by
Avila Cindy S
Current Estimated Value
Home Financials for this Owner
Home Financials are based on the most recent Mortgage that was taken out on this home.
Original Mortgage
$74,400
Outstanding Balance
$66,025
Interest Rate
2.9%
Mortgage Type
Commercial
Estimated Equity
$34,495
Purchase Details
Closed on
Jan 14, 2016
Sold by
Fisher Kevin
Bought by
Fisher Christina
Home Financials for this Owner
Home Financials are based on the most recent Mortgage that was taken out on this home.
Original Mortgage
$52,000
Interest Rate
3.98%
Mortgage Type
Purchase Money Mortgage
Purchase Details
Closed on
Feb 10, 1995
Sold by
Avila Christina
Bought by
Fisher Christina A
Purchase Details
Closed on
Feb 24, 1992
Sold by
Avila Agustin M and Avila Guadalupe
Bought by
Fisher Christina A
Create a Home Valuation Report for This Property
The Home Valuation Report is an in-depth analysis detailing your home's value as well as a comparison with similar homes in the area
Home Values in the Area
Average Home Value in this Area
Purchase History
| Date | Buyer | Sale Price | Title Company |
|---|---|---|---|
| Avila Cindy S | -- | None Available | |
| Fisher Christina | -- | Attorney | |
| Fisher Christina A | -- | -- | |
| Fisher Christina A | -- | -- |
Source: Public Records
Mortgage History
| Date | Status | Borrower | Loan Amount |
|---|---|---|---|
| Open | Avila Cindy S | $74,400 | |
| Previous Owner | Fisher Christina | $52,000 |
Source: Public Records
Tax History Compared to Growth
Tax History
| Year | Tax Paid | Tax Assessment Tax Assessment Total Assessment is a certain percentage of the fair market value that is determined by local assessors to be the total taxable value of land and additions on the property. | Land | Improvement |
|---|---|---|---|---|
| 2025 | $1,500 | $73,520 | $25,180 | $48,340 |
| 2024 | $1,362 | $68,440 | $25,180 | $43,260 |
| 2023 | $1,160 | $58,300 | $25,030 | $33,270 |
| 2022 | $366 | $16,520 | $6,500 | $10,020 |
| 2021 | $308 | $12,710 | $0 | $0 |
| 2020 | $312 | $12,710 | $5,000 | $7,710 |
| 2019 | $322 | $12,710 | $5,000 | $7,710 |
| 2018 | $311 | $12,330 | $4,250 | $8,080 |
| 2017 | $574 | $22,870 | $4,250 | $18,620 |
| 2016 | $574 | $22,870 | $4,250 | $18,620 |
| 2015 | $885 | $53,230 | $7,500 | $45,730 |
| 2014 | $913 | $53,040 | $7,500 | $45,540 |
| 2013 | $813 | $43,550 | $0 | $0 |
Source: Public Records
Map
Nearby Homes
- 901 Koberlin St
- 110 N Pope St
- 721 Spaulding St
- 1306 Spaulding St Unit 9
- 1516 E Harris Ave
- 502 N Browning St
- 419 N Pope St
- 1402 Spaulding St
- 731 Veck St
- 606 Pulliam St
- 119 N Malone St
- 420 N Malone St
- 1806 Ellis St
- 1802 Ellis St
- 6 N Bell St Unit 21
- 407 Koberlin St
- 415 E Harris Ave
- 1517 Culberson St
- 610 Jones St
- 614 N Poe St Unit 1A
- 210 N Baze St
- 1002 Koberlin St
- 1001 Spaulding St
- 219 N Baze St Unit 221
- 930 Koberlin St
- 221 N Baze St
- 925 Spaulding St
- 925 Spaulding St
- 924 Koberlin St
- 921 Spaulding St
- 1028 Koberlin St
- 215 N Buchanan St
- 918 Koberlin St
- 223 N Buchanan St
- 917 Spaulding St
- 1030 Koberlin St
- 912 Koberlin St
- 913 Spaulding St Unit 915
- 1017 Koberlin St
- 931 Koberlin St